
From Standard Form to Slope-Intercept - Graphing
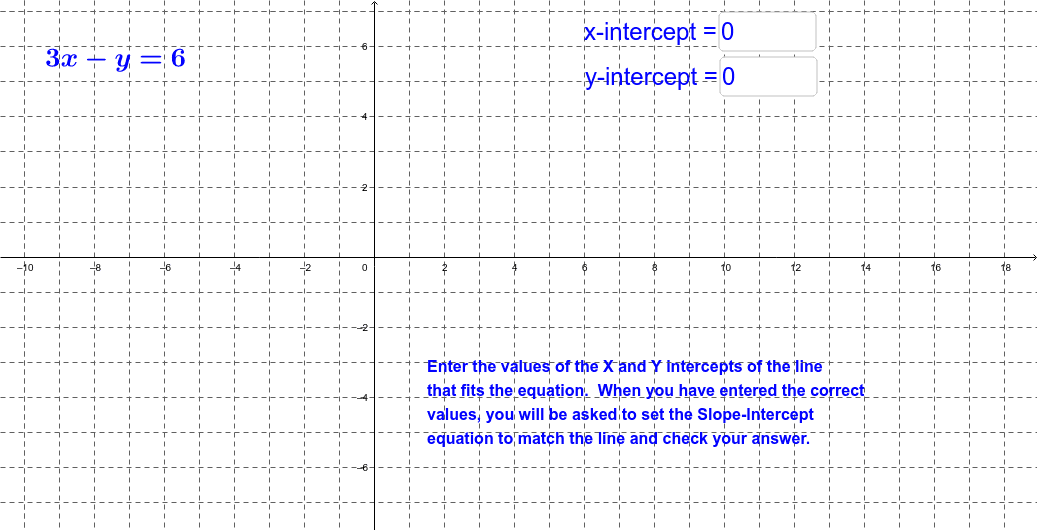
Loading the math board and drawing, please wait…
In collections
Lines and linear equations
This example guides students in graphing linear equations in standard form using x and y intercepts. Then, they convert the equation to slope-intercept form using the graph. Commands used include RandomElement, Line, FractionText, and Textfield. Suitable for middle school and above students to learn the graphical representation and conversion of linear equations.
GeoGebra Commands & Parameters
RandomElement({-6, -5, -4, -3, -2, -1, 1, 2, 3, 4, 5, 6}) → bRandomElement({-9, -8, -7, -6, -5, -4, -3, -2, -1, 1, 2, 3, 4, 5, 6, 7, 8, 9}) → aLine(A, B) → cFractionText(Slope[c]) → mTextfield(e) → inputBox1Textfield(h) → inputBox2Textfield(i) → inputBox3
AI Drawing Prompt Reference
Draw a line using x-intercept and y-intercept. First, randomly select a value for b, then select another value for a, and draw the line using these values. Calculate the slope of the line and display it as a fraction. Finally, use input box 1 for the x-intercept, input box 2 for the y-intercept, and input box 3 for the slope of the line.
The prompt above was compiled from the original drawing commands and is for reference only.