
From Relative Growth/Decay to Exponential Function
Loading the math board and drawing, please wait…
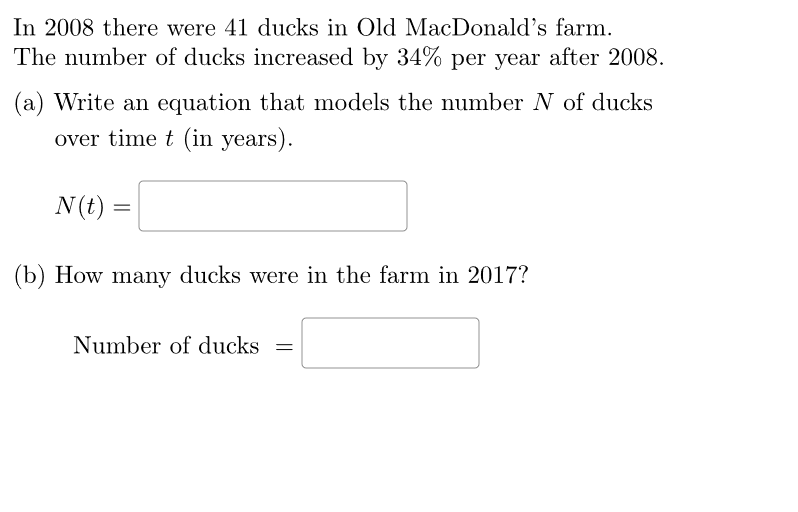
This example guides students to build an exponential model given a growth/decay rate. It involves the core mathematical concept of exponential functions. Using GeoGebra commands like RandomElement, Random, Textfield, etc., students can dynamically explore the properties of exponential functions. Suitable for high school mathematics education, especially for learning about exponential functions and model fitting.
GeoGebra Commands & Parameters
RandomElement(beasts) → theBeast, "ducks"Random(2000, 2010) → startYrRandom(2011, 2021) → endYrRandom(12, 120) → aZeroRandom(21, 36) → growthPercCorner(5) → dimsTextfield(studF) → InputBox1Textfield(studBeasts) → InputBox2AreEqual(InputBox2, numBeasts) → correctb
AI Drawing Prompt Reference
Create a dynamic exponential function model showing the process from relative growth/decay rates to the function itself. Include randomly selected animal types, start and end years, initial quantity, and growth rate. Allow users to verify the animal quantity via input boxes and display relevant text, presenting the dynamic changes and model fitting of the exponential function.
The prompt above was compiled from the original drawing commands and is for reference only.