
Frequency Polygon Construction
Loading the math board and drawing, please wait…
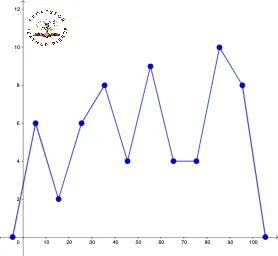
This example demonstrates how to construct a frequency polygon, a statistical graph showing data distribution. Key math concepts include histograms, polygon construction, function graphing, and arithmetic mean. It uses GeoGebra commands like Segment, Textfield, Max, and objects such as ul1, ll1, width, classes, A, B, f, etc. Suitable for high school statistics and geometry education to understand data visualization and polygon drawing techniques.
GeoGebra Commands & Parameters
Segment(A, B) → fSegment(C, D) → gTextfield(ll1) → InputBox1Textfield(ul1) → InputBox11Textfield(f1) → InputBox21Textfield(f2) → InputBox22Textfield(f3) → InputBox23Textfield(f4) → InputBox24Textfield(f5) → InputBox25Textfield(f6) → InputBox26Textfield(f7) → InputBox27Textfield(f8) → InputBox28Textfield(f9) → InputBox29Textfield(f10) → InputBox30Max(freq) → maxSegment(E, F) → hSegment(F, G) → iSegment(G, H) → jSegment(H, I) → kSegment(I, J) → lSegment(J, K) → mSegment(K, N) → nSegment(N, O) → pSegment(O, R) → qSegment(R, S) → rSegment(S, U) → sSegment(R, T) → tSegment(O, Q) → aSegment(N, P) → bSegment(K, M) → cSegment(J, L) → d
AI Drawing Prompt Reference
Draw a statistical graph to show data distribution, including multiple rectangular bars and a polygon connecting the tops of these bars to display frequency distribution. First, draw the bars, then connect the tops to form a polygon, and label key data points and statistical information.
The prompt above was compiled from the original drawing commands and is for reference only.