
Frequency Distribution and Riemann Sum GeoGebra Example
Loading the math board and drawing, please wait…
In collections
geometriadinamica.es
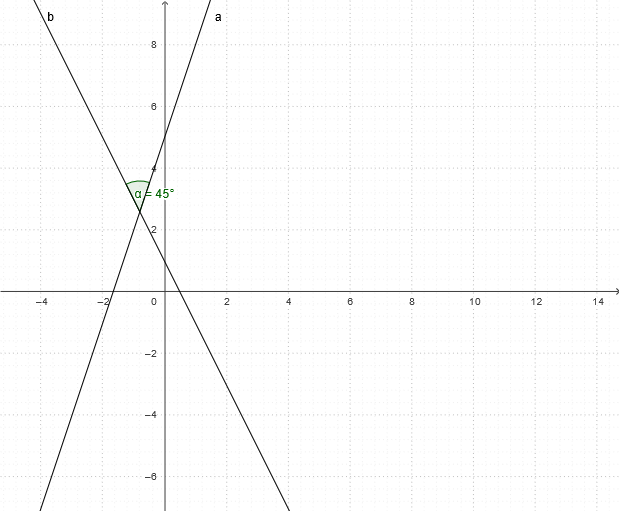
This example demonstrates how to use GeoGebra to plot a frequency distribution histogram and calculate Riemann sums; Core math concepts include frequency distribution, Riemann sum, complex number operations; Construction highlights: GeoGebra commands/objects used are Intersect (intersection), Point (point), Angle (angle); Suitable for high school mathematics teaching, helping to understand the geometric meaning of integration and numerical approximation.
GeoGebra Commands & Parameters
Intersect(a, b) → APoint(b) → BPoint(a) → CAngle(C, A, B) → α
AI Drawing Prompt Reference
Draw a frequency distribution histogram. The histogram shows data distribution. Include a rectangular area representing a data group, with length and width corresponding to data range and frequency. Label frequency values next to the rectangle. Separate rectangles with gaps. The overall graphic is simple and clear, suitable for math teaching.
The prompt above was compiled from the original drawing commands and is for reference only.