
Free Fall Motion Function Graph Simulation
Loading the math board and drawing, please wait…
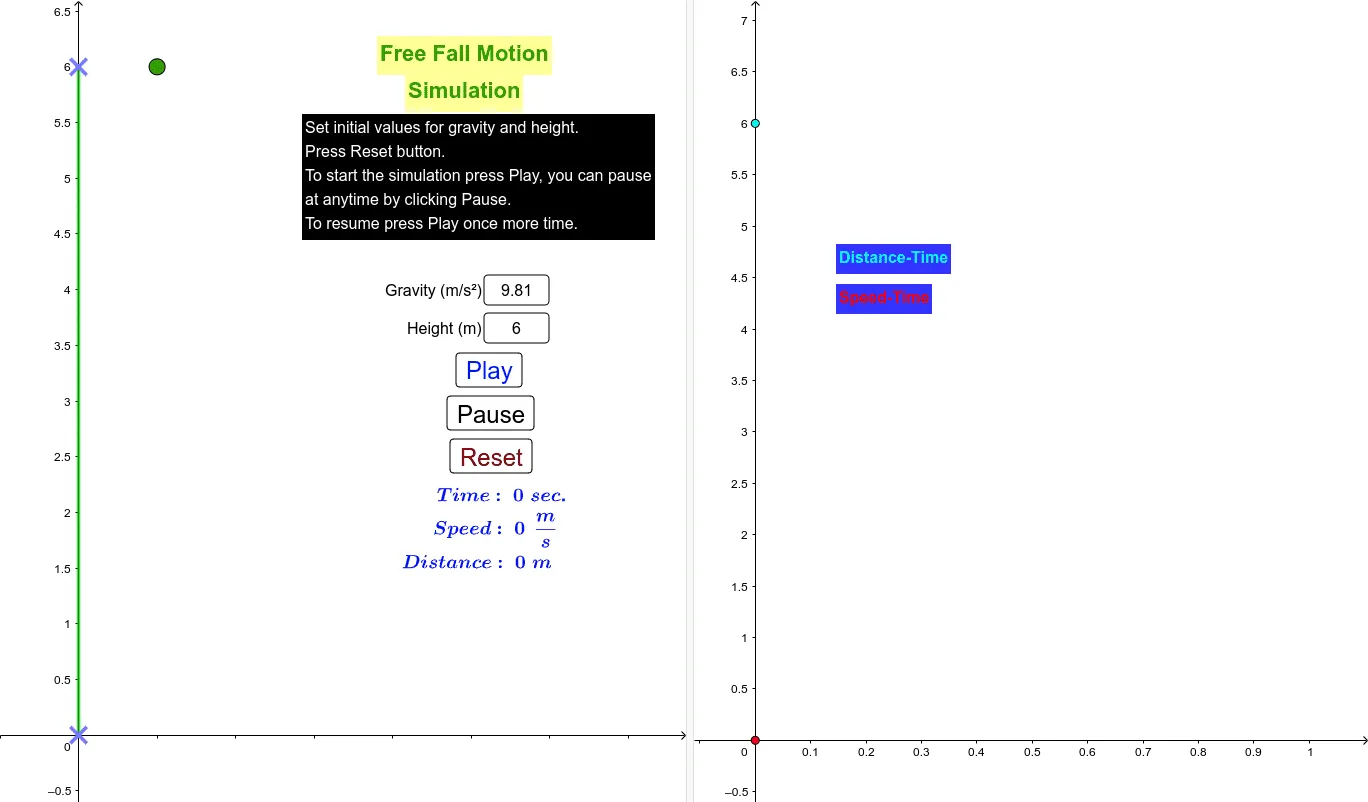
This example demonstrates the relationship between height and time in free fall motion using formula h=½gt². Core math concepts include quadratic function (parabola) graphs, logarithmic function graphs, and proportional relationships. Construction highlights: Textfield command for interactive parameter input; Point command for trajectory plotting; Intersect command for finding function intersections; Segment command for drawing line segments. Suitable for secondary school math courses on function graphing, physics kinematics visualization, and learning GeoGebra interactive worksheet creation.
GeoGebra Commands & Parameters
Textfield(h) → InputBox1Textfield(g) → InputBox2Point(xAxis) → APoint(xAxis) → BIntersect(xAxis, yAxis) → CPoint(Circle[C, h]) → DSegment(C, D) → f
AI Drawing Prompt Reference
Create a height-time graph for free fall motion using the formula h=½gt². First, input the gravitational acceleration g, then create two points A and B on the x-axis, find the origin C, draw a circle with C as the center and h as the radius, and finally draw a line segment f from C to the intersection of the circle and the x-axis.
The prompt above was compiled from the original drawing commands and is for reference only.