
France COVID-19 Cases Trend
Loading the math board and drawing, please wait…
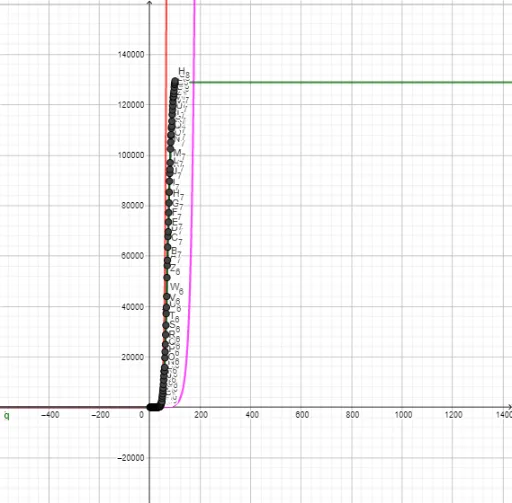
This example illustrates the trend of COVID-19 cases in France. It involves data visualization and statistical analysis, presenting the changes in cases over time through a line graph. Construction highlights include the use of GeoGebra's graphing tools and input of data points. Suitable for high school students and anyone interested in pandemic data.
GeoGebra Commands & Parameters
1323334354657686961061161261361461511161117111811191120112111221223122412251226122712281229123012