
Fractions: Circular Model
Loading the math board and drawing, please wait…
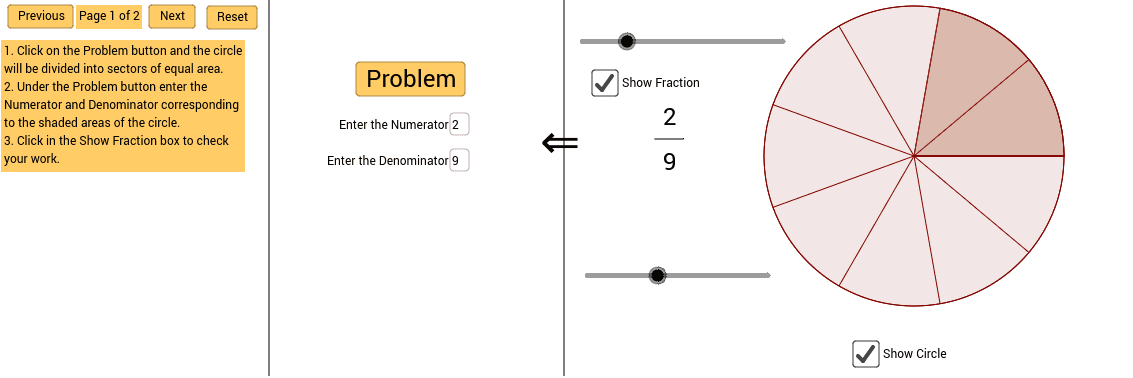
This example uses a circular model to help students visualize fractions. It involves the core mathematical concept of fractions. The construction highlights the use of commands such as Line, Sector, Sequence, and others. Suitable for high-grade elementary or junior high school students to learn about fractions.
GeoGebra Commands & Parameters
Line(Pt_1, Pt_2) → Part_1Line(Pt_3, Pt_4) → Part_2Sector(c, 0, ((360 * ° / Denominator) * Numerator)) → eSequence(Segment[(0, 0), ((3 * cos(θ)), (3 * sin(θ)))], θ, 0*°, 360*°, (360 * ° / Denominator)) → list1Vector(A, B) → uTranslate(list1, u) → list1'Sector(c, 0*°, 360*°) → dText(Numerator, E) → text5Segment(F, G) → aText(Denominator, D) → text4Join({{1}, denom}) → numRandomElement(num) → var_1RandomElement(denom) → var_2Textfield(Numerator_2) → inputBox1Textfield(Denominator_2) → inputBox2
AI Drawing Prompt Reference
Draw a circle and illustrate a fraction, such as 3/4. Start by drawing the circle, then draw a diameter to represent the fraction. Next, draw line segments from the center to the circumference to indicate the numerator. Draw another diameter to represent the denominator. Finally, label the numerator and denominator on the circle.
The prompt above was compiled from the original drawing commands and is for reference only.