
Fractions and Unity: Visualizing Unit Fractions via Circular Sectors and Polygon
Loading the math board and drawing, please wait…
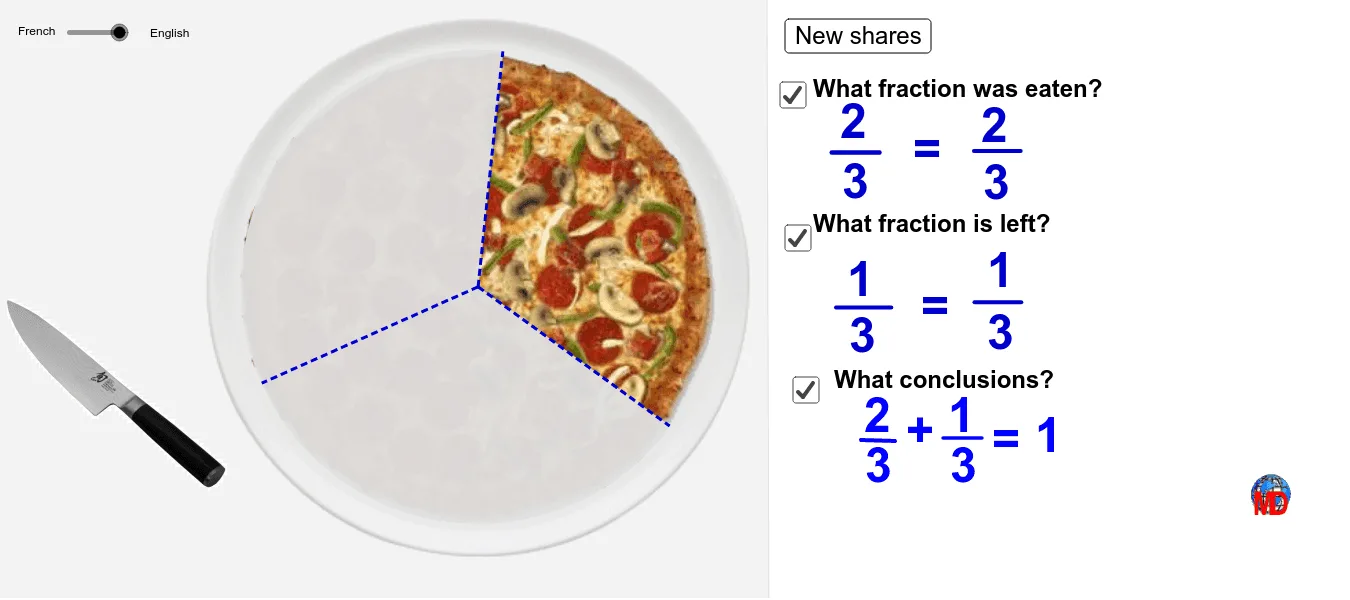
① This GeoGebra example demonstrates how a unit circle (or regular polygon) can be partitioned into equal sectors to visually represent fractions, showing the relationship between a part and the whole. ② Core mathematical concepts include the definition of fractions, unit fractions, part-whole relationships, the use of greatest common divisor (GCD) for equal division, and geometric transformations (rotation) combined with combinatorial counting. ③ Construction highlights: using GeoGebra commands such as Random, Point, Circle, Segment, Rotate, CircleSector, Sequence, GCD, and Polygon; objects include a slider (n) to control the number of divisions, sectors (sect), and dynamic text labels (text2, text7, etc.) to display the fraction value. ④ This is suitable for upper elementary to middle school students learning fraction concepts, geometric visualization, and the connection between number and shape, as well as for teachers creating interactive fraction lessons.
GeoGebra Commands & Parameters
Random(1, 360) → AnglePoint(Ray[A, A + (1, 0)]) → BRotate(B, 90°, A) → B'Midpoint(B', B) → CCircle(C, r) → cRotate(T, α, C) → PartageRandom(1, 10) → nRandom(1, n) → numSegment(D, E) → bSequence(Segment[C, Rotate[Partage, ((i * 360) * ° / n), C]], i, 1, n) → lignesRandom(0, 360) → coupeCircleSector(C, Partage, Rotate[Partage, (((n - num) * 360) * ° / n), C]) → sectSegment(F, G) → fGCD(num, n) → PgdSegment(H, I) → hSegment(J, K) → iPolygon(L, M, N, O) → poly1, l_1, m_1, n_1, o_1Segment(R, S) → a_1Segment(U, V) → b_1