
Fractions and Circle: Visualizing Fractions with Circle Sectors
Loading the math board and drawing, please wait…
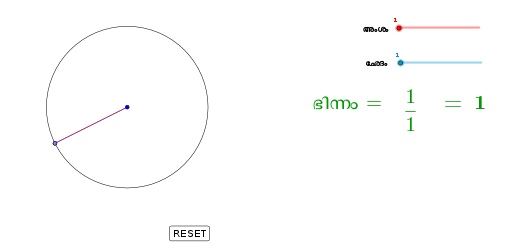
This GeoGebra example demonstrates how fractions can be represented visually by dividing a circle into sectors. It shows the relationship between a fraction (e.g., 1/2, 1/3) and the corresponding central angle and sector area. Core math concepts include fractions, circle geometry, central angles, and proportional reasoning. The construction uses GeoGebra commands such as Circle, Point, Rotate, Angle, and CircleSector to create the circle, define points, rotate them to form sectors, measure angles, and draw the sector regions. Objects include a button (button1), sliders (m), angle variable (Ang1), and multiple text labels (text1-text6) displaying fraction values. This interactive tool is suitable for upper elementary and middle school students learning fractions, as well as for teachers demonstrating the geometric interpretation of fractions in a classroom setting.
GeoGebra Commands & Parameters
Circle(A, 4) → cPoint(c) → BRotate(B, ((2 * a) * π / b), A) → B'Angle(B, A, Rotate[B, ((2 * a) * π / b), A]) → Ang1CircleSector(A, B', B) → c1CircleSector(A, B, B') → c2
AI Drawing Prompt Reference
Draw a circle with radius 4 centered at a central point. Pick an arbitrary point on the circumference. Then rotate this point around the center by an angle equal to (2 times an integer divided by another integer) times 360 degrees, producing a second point on the circle. Connect the center to both points with radii, and shade the sector between these two radii to highlight the fraction. Label the sector with its fractional value and the corresponding central angle measure. The diagram visually represents how fractions correspond to parts of a circle's area and angle.
The prompt above was compiled from the original drawing commands and is for reference only.