
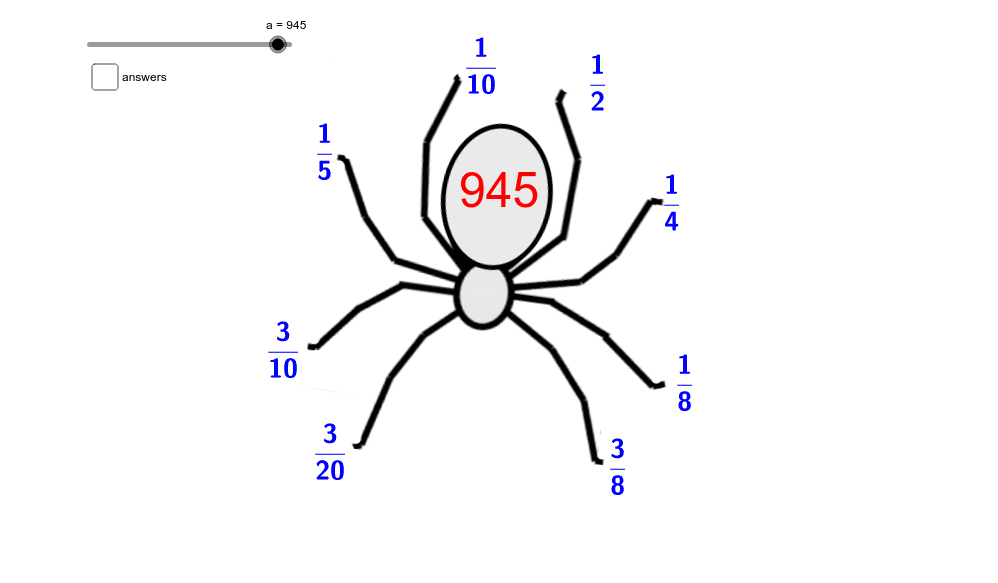
Fraction Spider
Loading the math board and drawing, please wait…
In collections
Lesson Starters
This example demonstrates the concept of fractions through an interesting 'spider' graphic. It involves addition and subtraction of fractions and the creation of a pie chart. By adjusting parameters, you can dynamically observe changes in fractions. This example uses GeoGebra objects such as text, points, and images, suitable for high-grade elementary and junior high school students to learn fractions and probability statistics.
GeoGebra Commands & Parameters
Point A(-10.42, -8.48)Point B(-0.8, -9.8)Numeric a(990.0)Point C_1(8.04, 1.58)Point D_1(8.02, 0.48)Point C(1.38, -3.76)Point D(10.8, -5.06)(0.375 * a)(0.125 * a)(0.25 * a)(a * 0.5)(0.1 * a)(0.2 * a)(0.3 * a)(0.15 * a)Boolean b(false)