
Fraction, Prism, and Pyramid Geometry Demo
Loading the math board and drawing, please wait…
In collections
Mapping Diagrams: From AB to C&DE, Resource
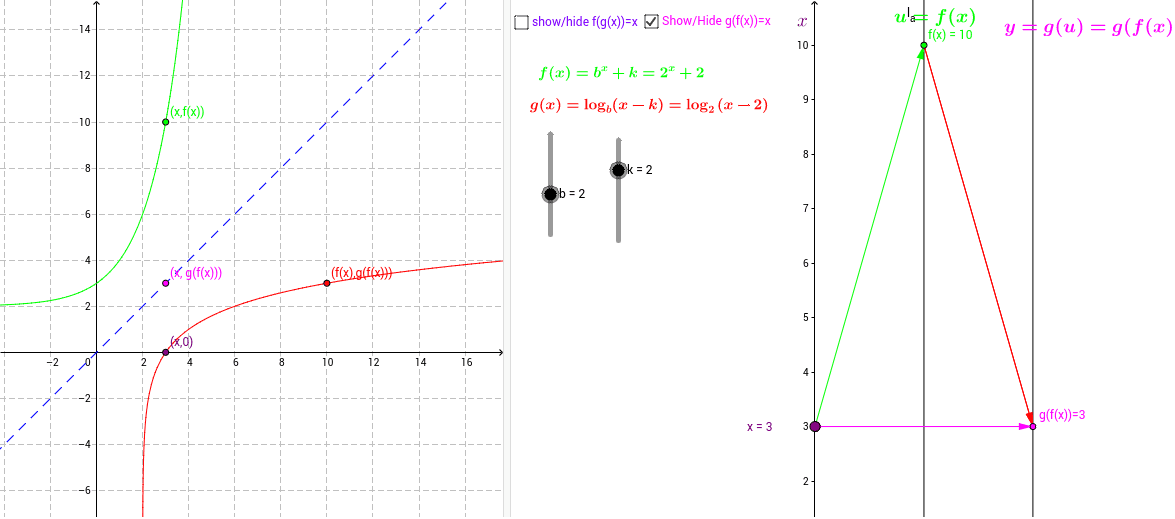
This example dynamically demonstrates the geometric relationships between fractions, prisms, and pyramids, visually showing the transformation between plane figures and solid shapes. It involves core math concepts like fraction operations, prism volume calculations, and polygon area derivation. Constructed using GeoGebra commands such as points, vectors, and textfields, with a focus on coordinate system building, vector operations, and dynamic graph generation. Suitable for high school mathematics teaching, particularly for interdisciplinary lessons on solid geometry and analytical geometry.
GeoGebra Commands & Parameters
Point(yAxis) → x_*Vector(x_*, B) → uVector(B, C) → vTextfield(g) → inputBox1Textfield(f) → inputBoxfVector(x_*, C) → wVector(x_*, F) → zVector(F, C) → dVector(F, gf_*) → eVector(x_*, gf_*) → i
AI Drawing Prompt Reference
Draw a cube and a regular tetrahedron to demonstrate their geometric relationships. First, set up a coordinate system, then create the vertices of the cube A, B, C, D, E, F, G, H, and the vertices of the tetrahedron P, Q, R, S. Use vector operations to show how the cube can be cut to form the tetrahedron, and calculate and display the volume and surface area of each geometric shape.
The prompt above was compiled from the original drawing commands and is for reference only.