
Fraction, Percentage, and Coefficient
Loading the math board and drawing, please wait…
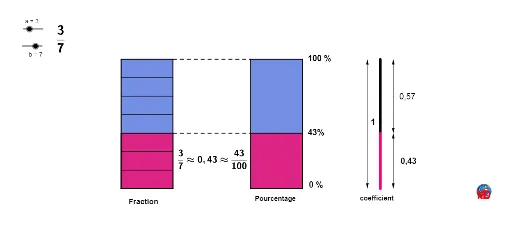
This example uses GeoGebra to demonstrate the relationship between fractions, percentages, and coefficients. Key mathematical concepts include fractions, coefficients, and percentages. Using commands like Polygon, Segment, Circle, Midpoint, Line, Intersect, Vector, and Sequence, a series of geometric shapes are constructed to help students understand these concepts. Suitable for middle school and above students.
GeoGebra Commands & Parameters
Polygon(F, H, C, B) → poly1, f, h_1, c, b_1Polygon(D, E, C, B) → poly2, d, e, c_1, b_2Polygon(I, K, J, G) → poly3, i, k, j, g_1Polygon(A, L, G, J) → poly4, a_1, l, g_2, j_1Segment(E, L) → mSegment(H, I) → nSegment(O, M) → pSegment(N, M) → qCircle(O, 1) → rMidpoint(E, C) → PLine(O, m) → sCircle(M, 1) → tCircle(N, 1) → c1Line(N, s) → a1Line(M, a1) → b1Intersect(r, s) → Q, RIntersect(c1, a1) → S, TIntersect(t, b1) → U, VMidpoint(Q, U) → WMidpoint(R, T) → ZMidpoint(T, V) → A1Vector(Z, R) → uVector(Z, T) → vVector(A1, T) → wVector(A1, V) → zVector(W, Q) → u1Vector(W, U) → v1Segment(O, R) → d1Segment(N, T) → e1Segment(M, V) → f1Sequence(Translate[B, Vector[(i * Vector[B, F])]], i, 0, 1, 1 / b) → liste1Sequence(Translate[C, Vector[(i * Vector[B, F])]], i, 0, 1, 1 / b) → liste2Sequence(Segment[Element[liste1, i], Element[liste2, i]], i, 1, Length[liste1]) → liste3
AI Drawing Prompt Reference
Draw a geometric figure composed of multiple polygons to demonstrate the relationship between fractions, percentages, and coefficients. Start by creating two adjacent polygons, then connect their vertices to form segments and circles. Next, find the intersections of the segments and circles, and use these points to draw new circles and lines. Finally, generate a series of segments through vector operations and sequences to show the dynamic relationship between the geometric shapes.
The prompt above was compiled from the original drawing commands and is for reference only.