
Fraction Comparison
Loading the math board and drawing, please wait…
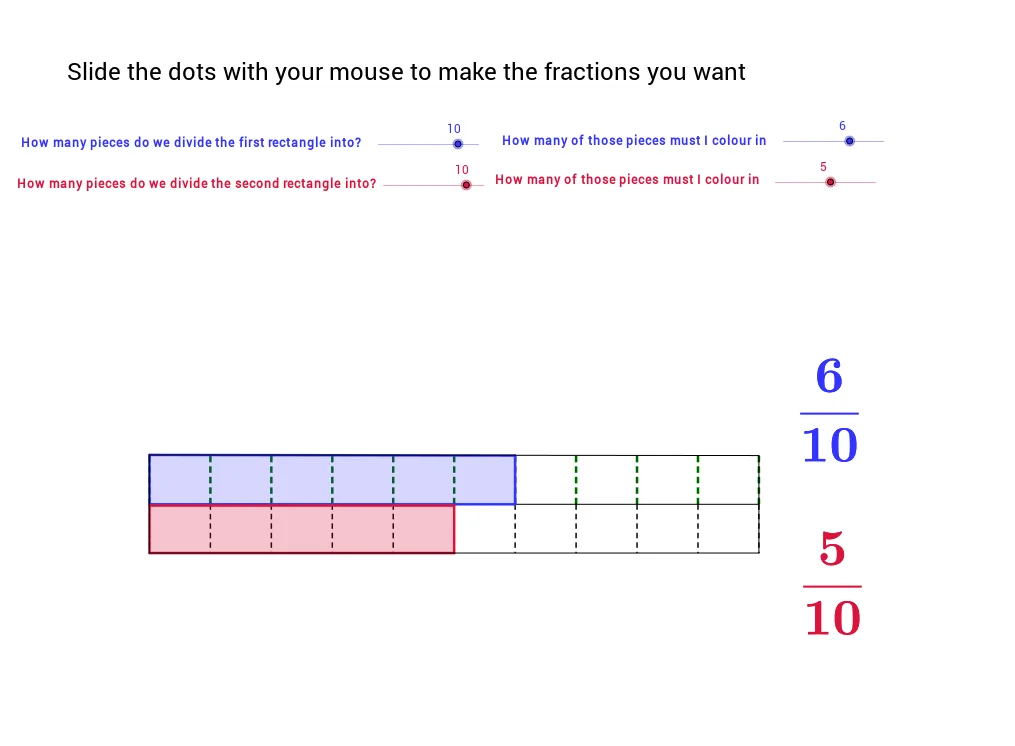
This example demonstrates how to visually compare two fractions using graphical methods. Core math concepts include fractions, Least Common Multiple (LCM), sequences, and polygon construction. GeoGebra commands and objects like LCM, Sequence, Element, Segment, Polygon are used to build the comparison model. Suitable for middle school students and above to learn fraction comparison and geometric applications, or for mathematical teaching demonstrations.
GeoGebra Commands & Parameters
LCM(den1, den2) → bSequence((-5 + i * 10 / den1, 0), i, 0, den1) → list1Element(list1, 1) → cSequence((-5 + i * 10 / den1, 0.8), i, 0, den1) → list2Sequence(Segment[Element[list1, i], Element[list2, i]], i, 1, den1 + 1) → list3Sequence((-5 + i * 10 / den2, 0), i, 0, den2) → list4Sequence((-5 + i * 10 / den2, -0.8), i, 0, den2) → list5Sequence((-5 + i * 10 / b, 0), i, 0, b) → list7Sequence(Segment[Element[list4, i], Element[list5, i]], i, 0, den2 + 1) → list6Segment(D, C) → aPolygon(E, F, J_1, K_1) → poly1, e, f, j_1, k_1Polygon(H, G, K_2, J_2) → Poly2, h, g, k_2, j_2Segment(J_1, K_11) → dSegment(J_1, K_2) → iSegment(K_2, K) → jSegment(K_11, K) → k
AI Drawing Prompt Reference
Create a visual comparison of two fractions using graphical methods. First, calculate the least common multiple of the denominators of the two fractions. Then, use line segments and sequences to create a visual representation of each fraction, with one fraction represented by upward segments and the other by downward segments. Next, construct two polygons using these segments and connect their vertices to intuitively show the relationship between the fractions.
The prompt above was compiled from the original drawing commands and is for reference only.