
Fraction Comparison Intro
Loading the math board and drawing, please wait…
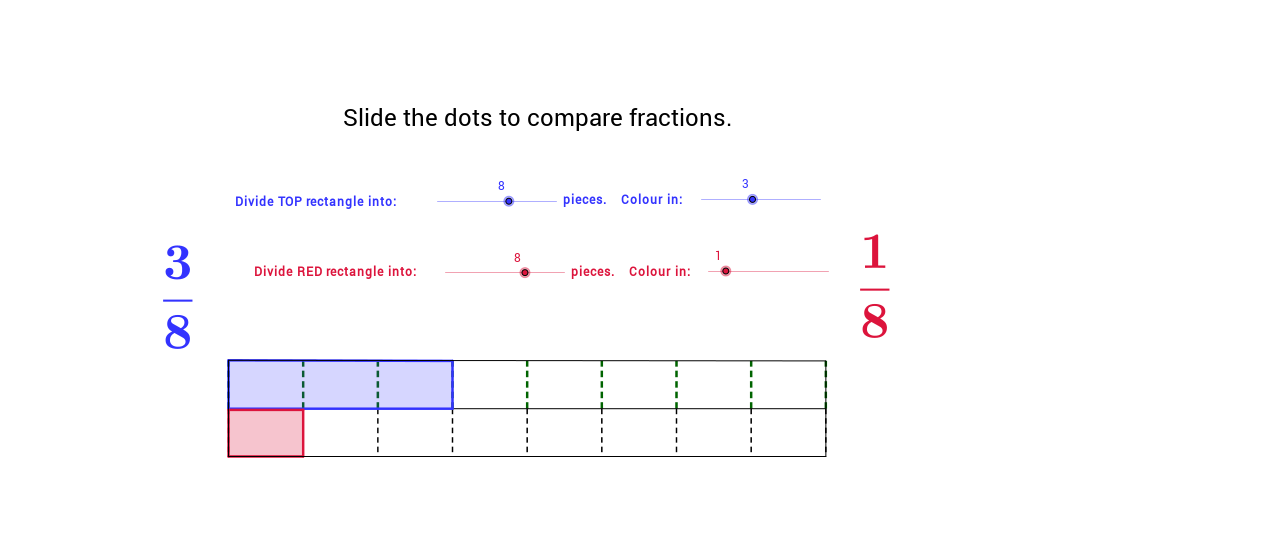
This example demonstrates how to visually compare the sizes of two fractions. Core math concepts include fraction comparison, least common multiple (LCM), sequences, and the connection between geometry and numbers. Construction highlights involve GeoGebra commands like LCM, Sequence, Element, Segment, Polygon, and objects like list1, list2, etc. Suitable for middle school mathematics teaching to help students intuitively understand fraction comparison methods.
GeoGebra Commands & Parameters
LCM(den1, den2) → bSequence(((-5) + (i * 10 / den1), 0), i, 0, den1) → list1Element(list1, 1) → cSequence(((-5) + (i * 10 / den1), 0.8), i, 0, den1) → list2Sequence(Segment[Element[list1, i], Element[list2, i]], i, 1, den1 + 1) → list3Sequence(((-5) + (i * 10 / den2), 0), i, 0, den2) → list4Sequence(((-5) + (i * 10 / den2), (-0.8)), i, 0, den2) → list5Sequence(((-5) + (i * 10 / b), 0), i, 0, b) → list7Sequence(Segment[Element[list4, i], Element[list5, i]], i, 0, den2 + 1) → list6Segment(D, C) → aPolygon(E, F, J_1, K_1) → poly1, e, f, j_1, k_1Polygon(H, G, K_2, J_2) → Poly2, h, g, k_2, j_2Segment(J_1, K_11) → dSegment(J_1, K_2) → iSegment(K_2, K) → jSegment(K_11, K) → k
AI Drawing Prompt Reference
Draw two parallel horizontal segments representing the denominators of two fractions. Divide each segment into equal parts matching its denominator, and add vertical lines at each division to create a grid of rectangles above the first segment and below the second. Insert a finer set of divisions based on the least common multiple of the denominators between them. Finally, shade corresponding rectangular regions with polygons to visually compare the sizes of the two fractions.
The prompt above was compiled from the original drawing commands and is for reference only.