
Fraction Comparer by Irina Boyadzhiev
Loading the math board and drawing, please wait…
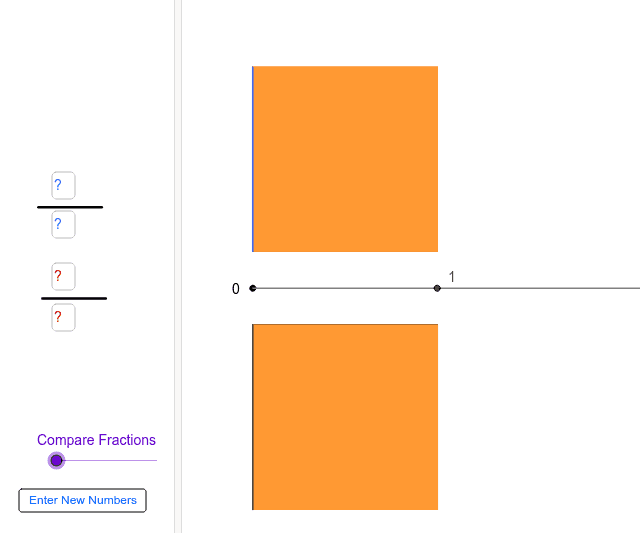
This example demonstrates how to visually compare fractions and understand the impact of numerators and denominators on fraction values. Key math concepts include the fundamental properties of fractions, the roles of numerators and denominators, and their representation on a number line. Construction highlights the use of GeoGebra commands and objects like Ray, Point, Segment, Textfield, Sequence, Line, Append, If, Polygon, Zip, Distance, Vector, Translate, Corner, Element. Suitable for middle school and above students to deepen their understanding of fractions through experimentation.
GeoGebra Commands & Parameters
Ray(A, X) → ray1Point(ray1) → BSegment(A, B) → aSegment(C, D) → bTextfield(n1) → inputBox1Textfield(d1) → inputBox2Textfield(n2) → inputBox3Textfield(d2) → inputBox4Sequence(A + ((i * a / d1) * UnitVector[a]), i, 1, d1) → list1Sequence(C + ((i * b / d2) * UnitVector[b]), i, 1, d2) → list2Segment(C, Element[list2, n2]) → dSegment(E, F) → eSegment(G, H) → fSequence(E + ((i * e / n) * UnitVector[e]), i, 1, n) → list3Sequence(G + ((i * f / n) * UnitVector[f]), i, 1, n) → list4Sequence(Segment[Element[list3, i], Element[list4, i]], i, 1, n) → list5Line(E, G) → gAppend(g, list5) → cutsIf(Mod[n, d1] ≟ 0, true, false) → firstIf(Mod[n, d2] ≟ 0, true, false) → secondTextfield(n1a) → inputBox5Textfield(d1a) → inputBox6Textfield(n2a) → n2sIf((n1 * d1a) ≟ (d1 * n1a) ∧ Mod[d1a, LCM[d1, d2]] ≟ 0, true, false) → a1If((n2 * d2a) ≟ (d2 * n2a) ∧ Mod[d2a, LCM[d1, d2]] ≟ 0, true, false) → a2Textfield(d2a) → inputBox9If(first ∧ second, true, false) → sPolygon(A, B, 4) → poly1, h, i, j, k, Q, RPolygon(D, C, 4) → poly2, l, m, p, q, S, TZip(Segment[Y, (x(Y), y(Y) + Distance[A, B])], Y, list1) → list6Polygon(A, Element[list1, n1], (x(Element[list1, n1]), y(Element[list1, n1]) + Distance[A, B]), R) → poly3, a_1, r, t, r_1Distance(A, B) → sideZip(Segment[Y, (x(Y), y(Y) - Distance[A, B])], Y, list2) → list7Polygon(C, Element[list2, n2], (x(Element[list2, n2]), y(Element[list2, n2]) - Distance[A, B]), S) → poly4, c, b_1, c_1, s_1Sequence(Line[Element[list3, i], Element[list4, i]], i, 1, n) → list8Sequence(S + ((i * b / d2) * UnitVector[b]), i, 1, d2) → list22Ray((1, 0), (10, 0)) → d_1Vector((0, 0), (0, -0.95)) → uVector((0, 0), (0, 0.95)) → vTranslate(a_1, Vector[(translate * u)]) → e_1Translate(c, Vector[(translate * v)]) → c'Corner(e_1, 2) → UElement(list1, n1) → end_e1Translate(end_e1, Vector[(translate * u)]) → EEElement(list2, n2) → EndTranslate(End, Vector[(translate * v)]) → EE2Sequence(R + ((i * a / d1) * UnitVector[a]), i, 1, d1 - 1 / d1) → list11Segment(V, W) → f_1Segment(Z, A_1) → g_1Point(f_1) → B_1
AI Drawing Prompt Reference
Draw two rays starting from the same point and extending in different directions, forming a line segment. Mark points on the segment corresponding to two input fractions and connect them to form two quadrilaterals. Also, draw line segments on a number line representing the two fractions and compare their lengths. Combine all these shapes to visually demonstrate the comparison of fractions and their fundamental properties.
The prompt above was compiled from the original drawing commands and is for reference only.