
Fraction Board: Quartiles
Loading the math board and drawing, please wait…
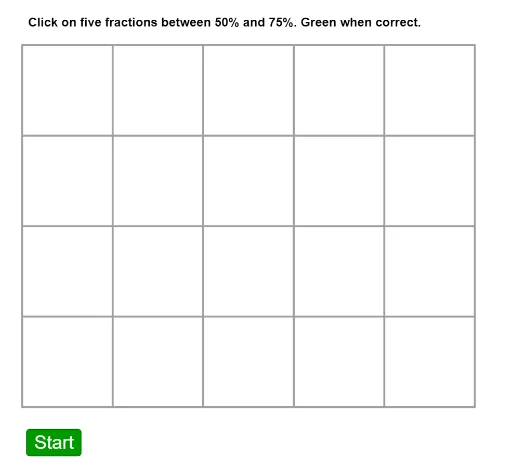
This interactive fraction board demonstrates the concept of quartiles by generating a set of random fractions, sorting them in ascending order, and dividing them into four intervals. It helps students visually grasp data distribution and positional measures. Core mathematical concepts include fractions, percentiles, quartiles, inequalities, and data ordering. The construction uses GeoGebra commands: Random to generate 20 random fraction objects (d1 to d20), Shuffle to randomize their order, and If/Sequence for conditional logic and sequence creation, resulting in a visual board. Suitable for middle or high school as a lesson starter for statistics and probability, or for reviewing fraction comparison and inequalities.
GeoGebra Commands & Parameters
Random(10, 100) → d1Random(10, 100) → d2Random(10, 100) → d3Random(10, 100) → d4Random(10, 100) → d5Random(10, 100) → d6Random(10, 100) → d7Random(10, 100) → d8Random(10, 100) → d9Random(10, 100) → d10Random(10, 100) → d11Random(10, 100) → d12Random(10, 100) → d13Random(10, 100) → d14Random(10, 100) → d15Random(10, 100) → d16Random(10, 100) → d17Random(10, 100) → d18Random(10, 100) → d19Random(10, 100) → d20Random((0.76 * d3), (0.99 * d3)) → n3Random((0.76 * d1), (0.99 * d1)) → n1Random((0.76 * d2), (0.99 * d2)) → n2Random((0.76 * d4), (0.99 * d4)) → n4Random((0.76 * d5), (0.99 * d5)) → n5Random((0.51 * d6), (0.74 * d6)) → n6Random((0.51 * d7), (0.74 * d7)) → n7Random((0.51 * d8), (0.74 * d8)) → n8Random((0.51 * d9), (0.74 * d9)) → n9Random((0.51 * d10), (0.74 * d10)) → n10Random((0.26 * d11), (0.49 * d11)) → n11Random((0.26 * d12), (0.49 * d12)) → n12Random((0.26 * d13), (0.49 * d13)) → n13Random((0.26 * d14), (0.49 * d14)) → n14Random((0.26 * d15), (0.49 * d15)) → n15Random((0.05 * d11), (0.24 * d11)) → n16Random((0.05 * d17), (0.24 * d17)) → n17Random((0.05 * d18), (0.24 * d18)) → n18Random((0.05 * d19), (0.24 * d19)) → n19Random((0.05 * d20), (0.24 * d20)) → n20Shuffle(listpoints) → lp, {(4.302430303644675, 4.775637903536341), (0.33259906512068393, 2.769193915301872), (2.321820358177177, 1.7702775949791318), (0.3239877175316948, 1.7616662473901428), (1.3401267330324143, 4.767026555947352), (1.331515385443425, 2.777805262890861), (1.331515385443425, 1.778888942568121), (1.3401267330324143, 3.759498888035623), (3.3379593736778963, 1.7616662473901428), (4.3196529988226535, 1.7616662473901428), (3.3293480260889075, 3.776721583213601), (3.3379593736778963, 2.769193915301872), (2.3304317057661663, 4.767026555947352), (3.3379593736778963, 4.758415208358363), (2.3304317057661663, 3.768110235624612), (0.3412104127096731, 3.768110235624612), (0.3412104127096731, 4.758415208358363), (4.311041651233664, 3.768110235624612), (2.3132090105881877, 2.777805262890861), (4.3196529988226535, 2.777805262890861)}Random(1, 4) → qIf(q ≟ 1, textq1, If[q ≟ 2, textq2, If[q ≟ 3, textq3, textq4]]) → textqSequence(Segment[(n, 1), (n, 5)], n, 0, 5) → l1Sequence(Segment[(0, m), (5, m)], m, 1, 5) → l2
AI Drawing Prompt Reference
Draw a 5x5 grid board with 20 randomly placed points, each representing a fraction value. These fractions are divided into four quartile intervals, marked with distinct colors or shapes to illustrate the concept of quartiles. A randomly selected question text appears near the board, prompting students to determine which quartile interval a given fraction belongs to. The layout is clear for observing data distribution and positional relationships.
The prompt above was compiled from the original drawing commands and is for reference only.