
Fourier Series of a Square Wave and Transition to Its Fourier Transform
Loading the math board and drawing, please wait…
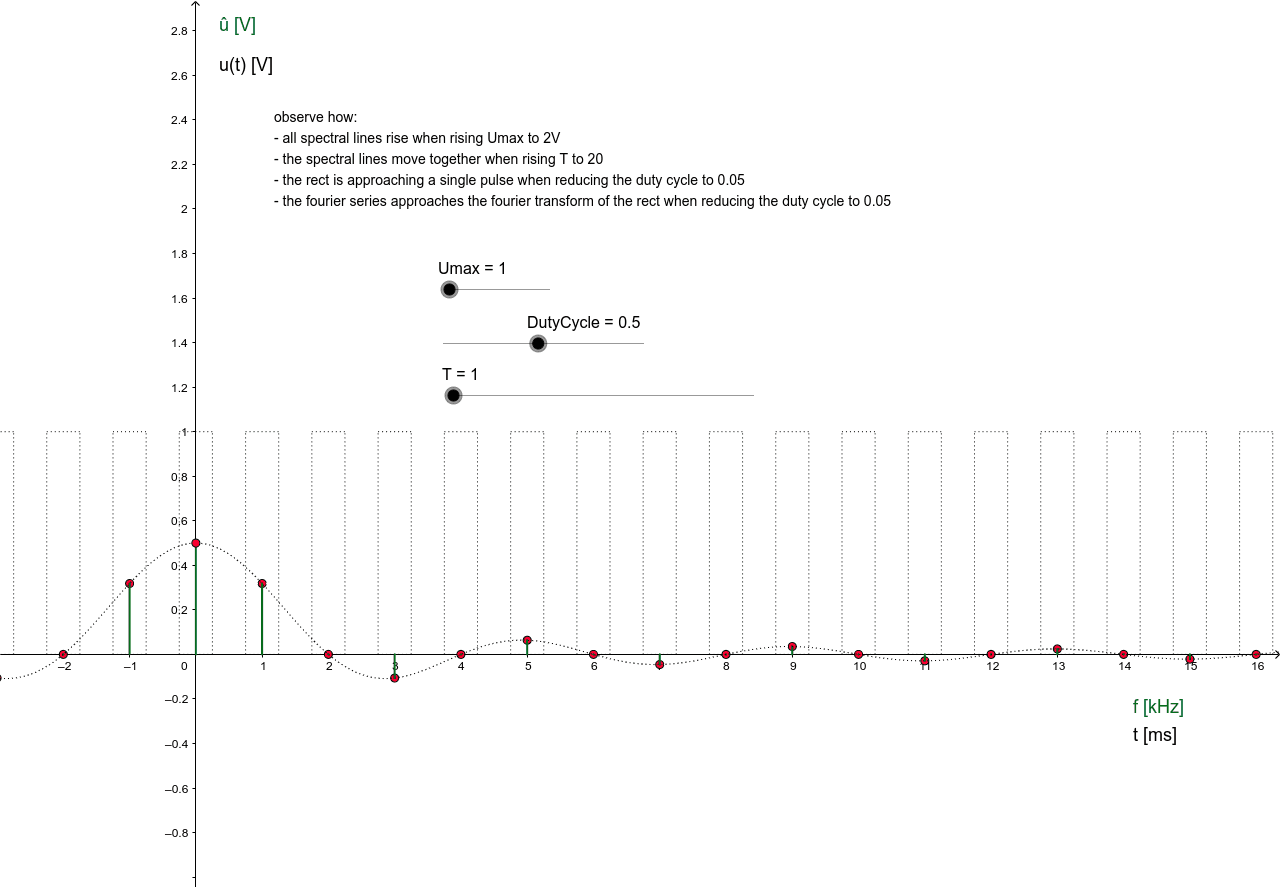
① This applet dynamically demonstrates how the Fourier series of a periodic square wave signal evolves into the Fourier transform as the signal becomes aperiodic, visually showing the transition from discrete spectral lines to a continuous spectrum. ② Core mathematical concepts include Fourier series, Fourier transform, periodic vs. aperiodic signals, frequency spectrum, Gibbs phenomenon, and the effect of duty cycle on harmonic components. ③ Construction highlights: using GeoGebra commands Sequence to generate multiple harmonic sine terms and Segment to draw the square wave and spectral lines; sliders control duty cycle (DutyCycle), amplitude (Umax), and period (T); text objects (Text1–Text5) display the number of terms, frequencies, and transform results; objects L, G, H, f, s, r, t, u, M store intermediate calculations and graphical elements. ④ Suitable for university engineering or mathematics students studying Fourier analysis, also useful for advanced high school enrichment or teacher demonstrations to build intuition about the link between discrete and continuous spectra.
GeoGebra Commands & Parameters
Sequence((i / T, (Umax * sin(((i * 3.141592653589793) * DutyCycle)) / ((i * 3.141592653589793)))), i, -300, 300) → LSegment((0, 0), G) → HSequence(Segment[((i * T) - (T * DutyCycle / 2), 0), ((i * T) + (T * DutyCycle / 2), 0)], i, -100, 100) → sSequence(Segment[((i * T) - ((T * DutyCycle) * 0.5), Umax), ((i * T) + ((T * DutyCycle) * 0.5), Umax)], i, -100, 100) → rSequence(Segment[((i * T) - (T * DutyCycle / 2), 0), ((i * T) - (T * DutyCycle / 2), Umax)], i, -100, 100) → tSequence(Segment[((i * T) + (T * DutyCycle / 2), 0), ((i * T) + (T * DutyCycle / 2), Umax)], i, -100, 100) → uSequence(Segment[(i / T, 0), Element[L, i + 301]], i, -300, 300) → M
AI Drawing Prompt Reference
Draw a periodic square wave signal and adjust its period and duty cycle using sliders. Show how the Fourier series of the square wave evolves by plotting multiple harmonic sine terms. Use segments to draw the square wave and spectral lines, illustrating the transition from discrete spectral lines to a continuous spectrum. Finally, plot the Fourier transform results to demonstrate changes in harmonic components.
The prompt above was compiled from the original drawing commands and is for reference only.