
Four Color Challenge by figen
Loading the math board and drawing, please wait…
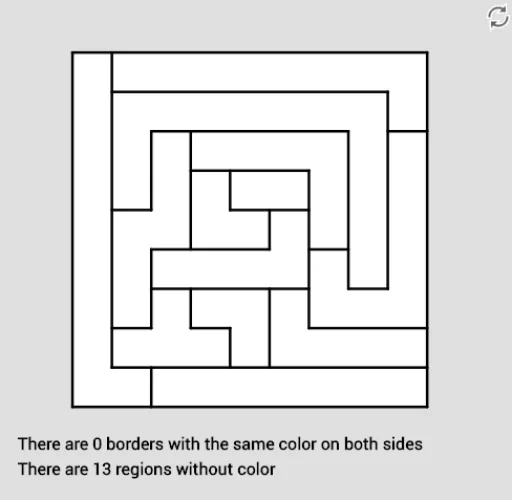
This example demonstrates the application of the Four Color Theorem in map coloring, requiring adjacent regions to have different colors. Key math concepts include graph theory, the Four Color Theorem, and adjacency relations between regions. GeoGebra commands used in construction are Segment, Polygon, Sum, and CountIf, along with objects like n (number of regions), color variables cB/cG/cR/cP (Blue/Green/Red/Purple), auxiliary objects aux, and text object texto2. It is suitable for middle school students and above to understand graph theory basics and logical reasoning, or as practice for math competitions or interest groups.
GeoGebra Commands & Parameters
Segment(A, C) → l_4Segment(C, Q_1) → k_5Segment(Q_1, O_1) → l_5Segment(O_1, A) → m_5Segment(B, E) → n_5Segment(D, H) → p_5Segment(D, P_1) → q_5Segment(I, J) → r_5Segment(J, U) → s_5Segment(O, R) → t_5Segment(P, K) → a_5Segment(K, L) → b_5Segment(L, F) → c_5Segment(Q, G) → d_5Segment(M, N) → f_6Segment(Z, A_1) → g_6Segment(A_1, H_1) → h_6Segment(H_1, J_1) → i_6Segment(I_1, V) → j_6Segment(U, W) → k_6Segment(W, C_1) → l_6Segment(B_1, D_1) → m_6Segment(F_1, B_1) → n_6Segment(E_1, G_1) → p_6Segment(G_1, M) → e_5Segment(X, Y) → q_6Segment(J_1, S) → r_6Segment(S, T) → s_6Segment(T, N_1) → t_6Segment(K_1, L_1) → a_6Segment(M_1, N_1) → b_6Polygon(B_1, D_1, G_1, F_1) → polígono1, b_7, d_6, g_7, f_7Polygon(V, W, C_1, B_1, F_1, E_1) → polígono2, v_3, w_3, c_6, b_8, f_8, e_6Polygon(O, R, D_1, C_1, W, U) → polígono3, o_3, r_7, d_7, c_7, w_4, u_3Polygon(X, Y, J_1, I_1, E_1, G_1) → polígono4, a_2, r_9, j_7, i_7, e_7, g_8Polygon(I, J, U, V, I_1, H_1, A_1, Z) → polígono5, i_8, j_8, u_4, v_4, i_9, h_7, a_7, z_4Polygon(D, F, L, K, P, O, J, I) → polígono6, d_8, f_9, l_7, k_7, p_7, o_4, j_9, i_{10}Polygon(F, G, Q, P, K, L) → polígono7, f_{10}, g_9, q_7, p_8, k_8, l_8Polygon(G, H, N, M, R, Q) → polígono8, g_{10}, h_8, n_7, m_7, r_8, q_8Polygon(M, N, L_1, K_1, T, S, Y, X) → polígono9, m_8, n_8, l_9, k_9, t_7, s_7, s_9, t_9Polygon(S, T, N_1, M_1, Z, A_1, H_1, J_1) → polígono10, s_8, t_8, n_9, m_9, z_5, a_8, h_9, j_{10}Polygon(K_1, L_1, Q_1, P_1, M_1, N_1) → polígono11, k_{10}, l_{10}, q_9, p_9, m_{10}, n_{10}Polygon(A, B, E, D, P_1, O_1) → polígono12, a_9, b_9, e_8, d_9, p_{10}, o_5Polygon(B, C, H, E) → polígono13, b_{10}, c_8, h_{10}, e_9Sum(frontera) → fmCountIf(ip ≟ 0, ip, pais) → pb
AI Drawing Prompt Reference
Draw a planar map composed of multiple polygonal regions that are adjacent to each other, forming a complex jigsaw-like layout. The map contains about thirteen irregular polygons, each bounded by several line segments with vertices at various positions. All regions must be colored using four colors (blue, green, red, purple) such that any two regions sharing a boundary have different colors. To construct, first draw the boundary segments of each region, then connect vertices to form closed polygons, and finally count the number of regions and verify that adjacent regions satisfy the four-color theorem. The overall figure should clearly illustrate adjacency relations and coloring logic in graph theory.
The prompt above was compiled from the original drawing commands and is for reference only.