
Formal Limit Definition Demonstration
Loading the math board and drawing, please wait…
In collections
Fun with Functions
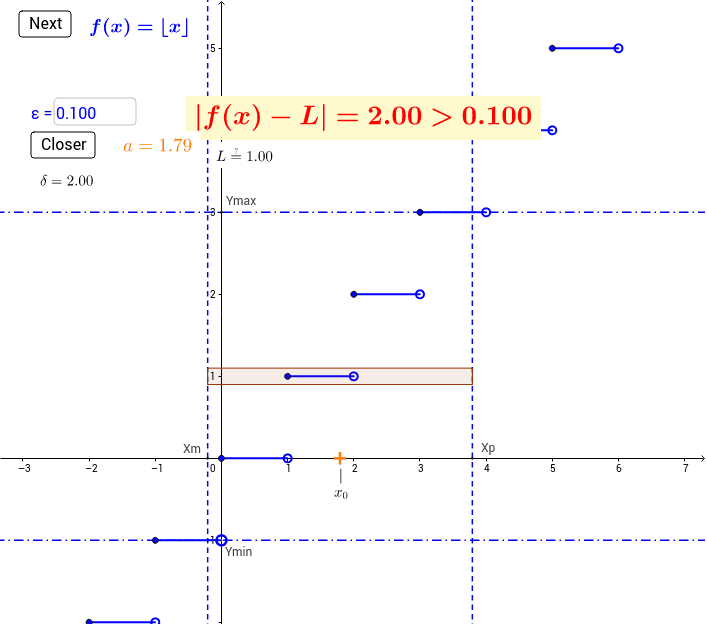
This example illustrates the formal definition of limits. The student can set an epsilon value and then decrease delta until the range is less than epsilon, visually understanding the concept of limits. The core math concept involved is the theory of limits. Construction highlights include using GeoGebra commands and objects such as Point, Element, If, Max, Textfield, OrthogonalLine, Polygon. Suitable for high school and above students learning calculus.
GeoGebra Commands & Parameters
Point(xAxis) → goalPoint(xAxis) → SplitPointElement(flist, nf) → gIf((xm ≤ 1) ∧ (xp ≥ 1), Infinity, Min[f_7(xm), f_7(xp)]) → ym7If(xm ≥ xSplit, y(Min[f_{right}, xm, xp]), If[xp < xSplit, y(Min[f_{left}, xm, xp]), Min[y(Min[f_{left}, xm, xSplit]), y(Min[f_{right}, xSplit, xp])]]) → ym5If((xp * xm) ≤ 0, 0, Min[If[xp < 0, (-xp), If[xp ≤ 1, xp^(2), 1]], If[xm < 0, (-xm), If[xm ≤ 1, xm^(2), 1]]]) → ym3If((xp ≥ 1) ∧ (xm ≤ 1) ∧ (aa ≠ 1), 2, xp) → yx8If((xm ≤ 1) ∧ (xp ≥ 1), Infinity, Max[f_7(xm), f_7(xp)]) → yx7If(xm ≥ xSplit, y(Max[f_{right}, xm, xp]), If[xp < xSplit, y(Max[f_{left}, xm, xp]), Max[y(Max[f_{left}, xm, xSplit]), If[xp ≟ xSplit, f_{right}(xSplit), y(Max[f_{right}, xSplit, xp])]]]) → yx5Max(If[xm < 0, (-xm), If[xm ≤ 1, xm^(2), 1]], If[xp < 0, 0, If[xp ≤ 1, xp^(2), 1]]) → yx3If(nf < 8, g(aa), If[nf ≟ 8 ∧ aa ≟ 1, 1, If[nf ≟ 9 ∧ aa ≟ 0, 2.7183, g(aa)]]) → LElement(maxlist, nf) → ymaxElement(minlist, nf) → yminMax(L - ymin, ymax - L) → epsilonTextfield(f_{left}) → inputBox1Textfield(f_{right}) → inputBox2OrthogonalLine(F, xAxis) → aOrthogonalLine(Xm, xAxis) → bOrthogonalLine(Xp, xAxis) → cOrthogonalLine(Ymin, yAxis) → dOrthogonalLine(Ymax, yAxis) → eTextfield(egoal) → inputBox3Polygon(G, C, B, A) → poly1, g_1, c_1, b_1, a_1
AI Drawing Prompt Reference
Draw a function graph to demonstrate the formal definition of limits. Set an epsilon value and gradually decrease delta until the range is less than epsilon, visually understanding the concept of limits. Include points on the x-axis and function value points, connect key points with orthogonal lines, display the epsilon and delta ranges, and highlight important areas with a polygon.
The prompt above was compiled from the original drawing commands and is for reference only.