
Flipping n coins m times
Loading the math board and drawing, please wait…
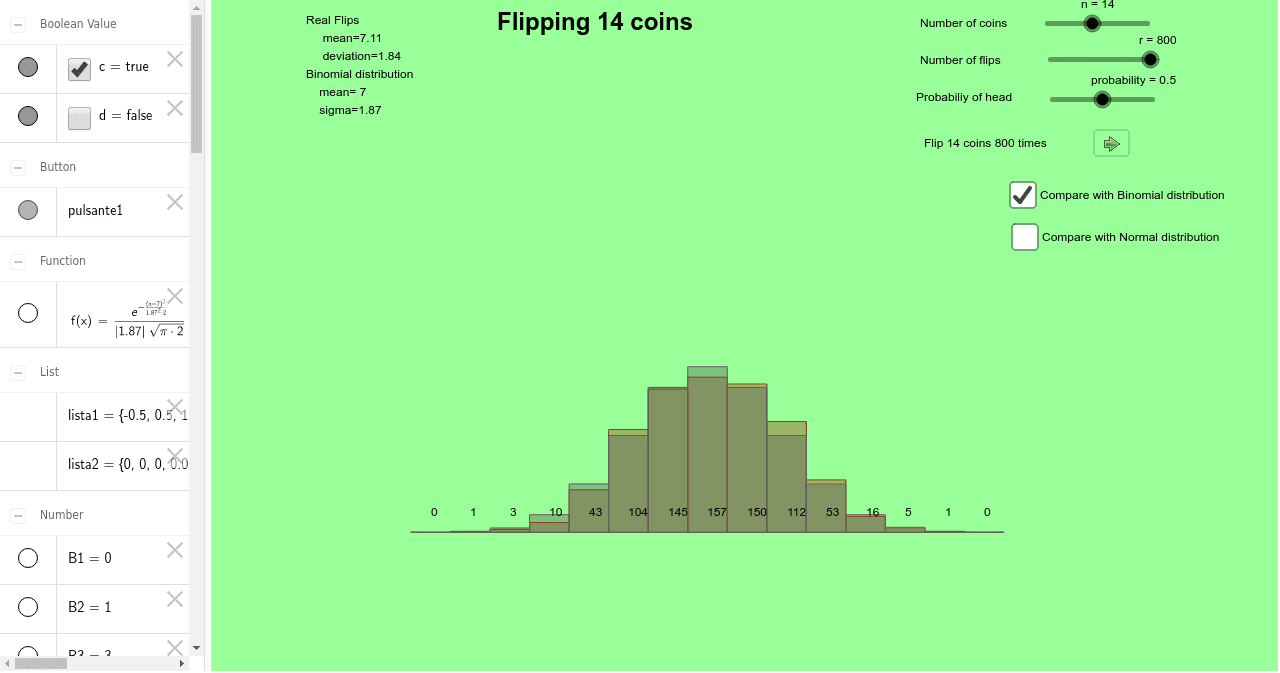
This example demonstrates the probability distribution and statistical outcomes of flipping n coins m times. It involves core mathematical concepts such as Probability & Statistics, Stochastic Process, Binomial Distribution, Normal Distribution, Definite Integral, and Histograms. The construction utilizes GeoGebra commands/objects like Sequence, Histogram, Text, BinomialDist, and Normal. It is suitable for high school and above learners to understand key ideas in probability theory and statistics visually.
GeoGebra Commands & Parameters
Sequence(i - 0.5, i, 0, n + 1) → lista1Histogram(lista1, lista2) → aText("www", (20, 20)) → testo4BinomialDist(n, probability) → bNormal(μ, σ, x) → fText("0", (0, 0.02)) → t0Text("1", (1, 0.02)) → t1Text("3", (2, 0.02)) → t2Text("10", (3, 0.02)) → t3Text("43", (4, 0.02)) → t4Text("104", (5, 0.02)) → t5Text("145", (6, 0.02)) → t6Text("157", (7, 0.02)) → t7Text("150", (8, 0.02)) → t8Text("112", (9, 0.02)) → t9Text("53", (10, 0.02)) → t10Text("16", (11, 0.02)) → t11Text("5", (12, 0.02)) → t12Text("1", (13, 0.02)) → t13Text("0", (14, 0.02)) → t14
AI Drawing Prompt Reference
Create a visual representation showing the probability distribution and statistical outcomes of flipping n coins m times, featuring a histogram displaying the frequency of different results, with text labels marking each result's value from 0 to 14, decreasing in frequency from high to low, resembling a binomial and normal distribution, suitable for teaching probability and statistics.
The prompt above was compiled from the original drawing commands and is for reference only.