
Five Number Summary and Mean Exploration
Loading the math board and drawing, please wait…
In collections
Statistics Demonstrations
Statistics Demonstrations
Statistics Demonstrations
Statistics Demonstrations
Statistics Demonstrations
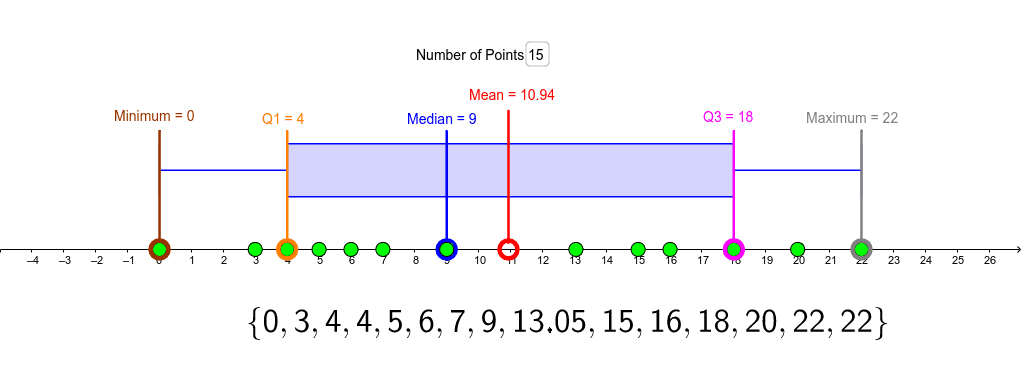
This example demonstrates how to use GeoGebra to create a five-number summary (min, Q1, median, Q3, max) and calculate the mean for a dataset. It involves core mathematical concepts like five-number summary, mean, data sorting, and distribution. Key GeoGebra commands and objects used include Textfield, If, Point, Take, Mean, Median, Q1, Q3, Min, Max, BoxPlot, CurveCartesian, Sort, LaTeX. Suitable for high school mathematics teaching, helping students understand data distribution and statistical calculations.
GeoGebra Commands & Parameters
Textfield(numpoints) → inputBox1If((numpoints > 0) ∧ (numpoints ≤ 15), numpoints, If[numpoints > 15, 15, If[numpoints ≤ 0, 1]]) → numberofpointsPoint(xAxis) → A1Point(xAxis) → A2Point(xAxis) → APoint(xAxis) → BPoint(xAxis) → CPoint(xAxis) → DPoint(xAxis) → EPoint(xAxis) → FPoint(xAxis) → GPoint(xAxis) → HPoint(xAxis) → IPoint(xAxis) → JPoint(xAxis) → KPoint(xAxis) → LPoint(xAxis) → MTake(points, 1, numpoints) → vispointsMean(vispoints) → meanofpointsMedian(vispoints) → medianofpointsQ1(vispoints) → q1Q3(vispoints) → q3Min(vispoints) → minofpointsMax(vispoints) → maxofpointsBoxPlot(3, 1, vispoints) → aCurveCartesian(meanofpoints, t, t, 0.25, 5.25) → bCurveCartesian(medianofpoints, t, t, 0.25, 4.5) → cCurveCartesian(q3, t, t, 0.25, 4.5) → eCurveCartesian(q1, t, t, 0.25, 4.5) → dCurveCartesian(minofpoints, t, t, 0.25, 4.5) → fCurveCartesian(maxofpoints, t, t, 0.25, 4.5) → gSort(vispoints) → list1LaTeX(list1, true, false) → text7
AI Drawing Prompt Reference
Create an interactive statistical plot on a coordinate plane. Allow the user to set the number of data points (between 1 and 15) via an input field, generating that many draggable points on the x-axis as the dataset. Automatically compute and display the minimum, first quartile, median, third quartile, maximum, and mean, marking each with a vertical dashed line at its x-coordinate. Also draw a box plot to show the distribution, and display the sorted data points as a list nearby. The graph is for exploring the five-number summary and mean.
The prompt above was compiled from the original drawing commands and is for reference only.