
Fit Data to Quadratic
Loading the math board and drawing, please wait…
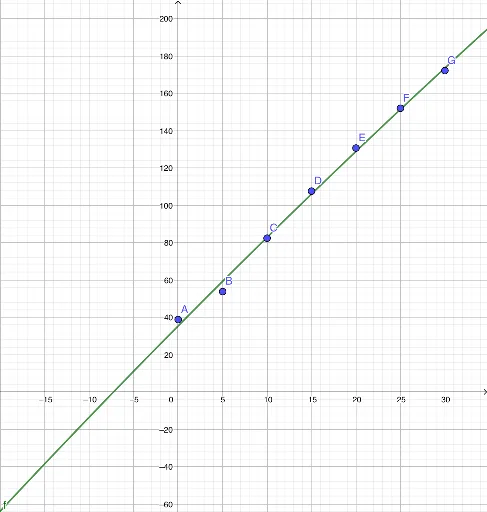
This example demonstrates how to fit data points to a quadratic function model using GeoGebra. Key math concepts include data fitting, quadratic functions, and coordinate geometry. The construction uses the FitPoly command on points A-G to create function f and display coefficients a, b. Suitable for high school mathematics education to understand data fitting and applications of quadratic functions.
GeoGebra Commands & Parameters
FitPoly(L_1, 2) → f
AI Drawing Prompt Reference
Plot a set of data points and fit them to a quadratic function curve, displaying the function graph and coefficients to illustrate the application of data fitting, quadratic functions, and coordinate geometry. First, draw the data points, then fit a quadratic function to these points to generate the curve, label the coefficients, and finally present the overall graphical relationship.
The prompt above was compiled from the original drawing commands and is for reference only.