
First Parabola: Plotting y = x²
Loading the math board and drawing, please wait…
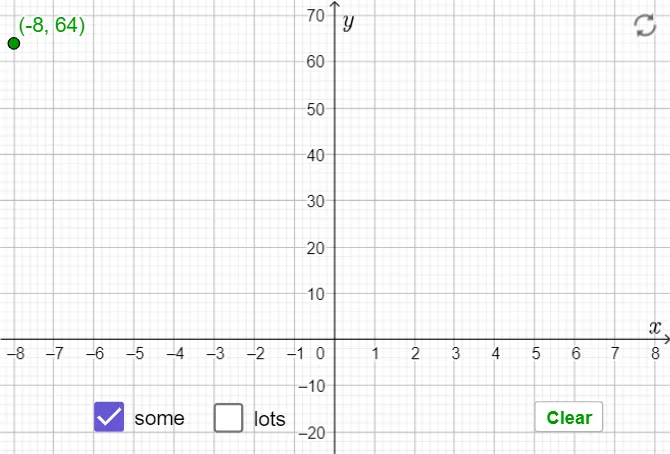
① This example demonstrates how to plot the graph of the quadratic function y = x², showing its characteristic parabolic shape and symmetry. ② The core mathematical concepts involve quadratic functions and parabolas, including the vertex, direction of opening, axis of symmetry, and how function values change with the independent variable. ③ Construction details: Based on the construction summary, the GeoGebra commands Corner and If are used, along with objects such as xvalue, dims, text1, P, button1, a, b, and incr. The Corner command likely positions axes or text, If may control conditional display or button behavior, and a, b, incr could serve as parameters or sliders to adjust coefficients or step increments, with a button for interactive control. ④ This is suitable for middle or high school students learning quadratic function graphs, and also useful for teachers in classroom demonstrations to visually explore parabola properties.
GeoGebra Commands & Parameters
Corner(5) → dimsIf(a ≟ 1, 1, 0.1) → incr
AI Drawing Prompt Reference
Draw a parabola with the equation y=x². First, set up the x-axis and y-axis. Then create a slider a with an initial value of 1 and a step size of 0.1. Next, plot the parabola y=x² and observe its vertex, axis of symmetry, and direction of opening.
The prompt above was compiled from the original drawing commands and is for reference only.