
First and Second Derivatives of a Function
Loading the math board and drawing, please wait…
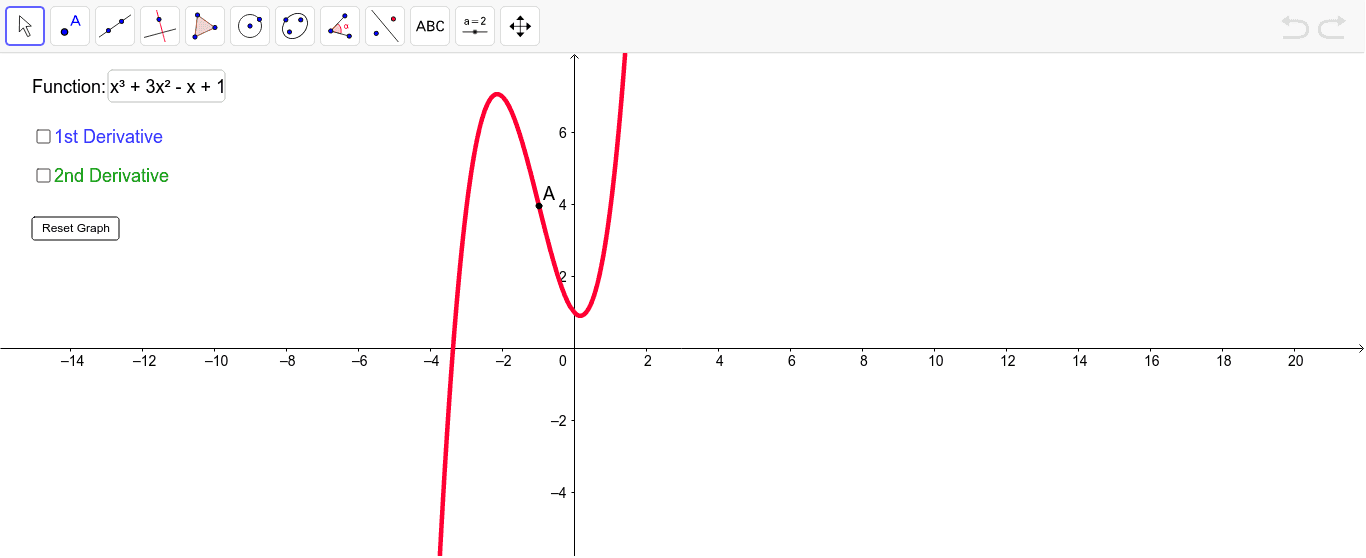
This GeoGebra example demonstrates the dynamic relationship between a function and its first and second derivatives by dragging a point along the graph of f. Core mathematical concepts include function graphs, first derivative, second derivative, geometric meaning of derivatives (tangent slope and concavity), and differential calculus. The construction uses GeoGebra commands Point to create a draggable point A on function f, Derivative to generate the first derivative g and second derivative h, and Textfield together with inputBox1 for function input; objects B, C, a, b and button1 support parameter linkage and annotation. It is suitable for high school calculus introduction and university mathematical analysis courses, ideal for visualizing derivative concepts and interactive classroom demonstration.
GeoGebra Commands & Parameters
Point(f) → ADerivative(f) → gDerivative(f, 2) → hTextfield(f) → inputBox1
AI Drawing Prompt Reference
Draw a dynamic graph showing a function together with its first and second derivatives. Start with an editable function curve, place a draggable point on that curve, and let the point move along the graph to reveal how the first derivative reflects tangent slope and the second derivative reflects concavity. Include a function input field for changing the original expression, with parameter linkage and brief annotations, so the diagram can be used for calculus teaching and interactive demonstration.
The prompt above was compiled from the original drawing commands and is for reference only.