
Exploring Maximums and Minimums of Functions
Loading the math board and drawing, please wait…
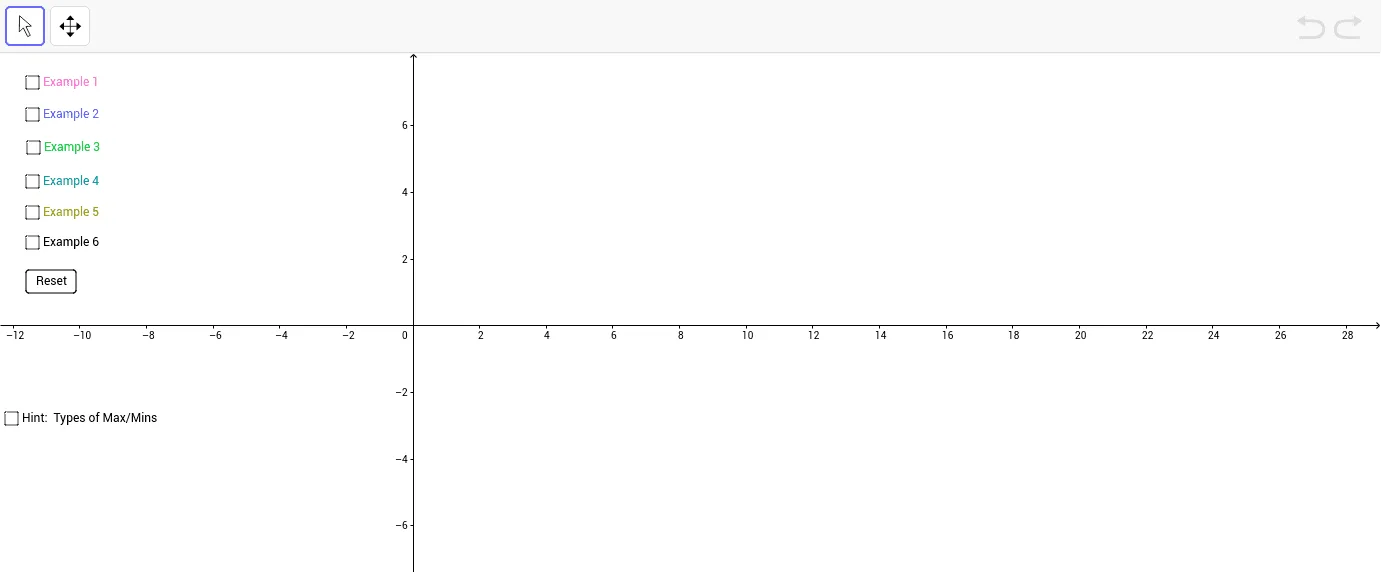
This example demonstrates how to explore the maximums and minimums of functions using GeoGebra. Key mathematical concepts include functions, derivatives, and extrema. By drawing function graphs, adding points, and sliders, users can intuitively understand the concept of extrema. Suitable for high school mathematics education and learning.
GeoGebra Commands & Parameters
Function(2 * x + 3, -3, 1) → fPoint(f) → AFunction((2 * x + 3) * (x - 1) * (x + 3) / ((x - 1) * (x + 3)), -3, 1) → gPoint(g) → DFunction(x^(2) - 2, -1, 2) → hFunction((x^(2) - 2) * x * (x - 2) / (x * (x - 2)), -1, 2) → iPoint(i) → JFunction(2 + 1 / (x - 2), -2, 5) → jPoint(j) → IPoint(k) → QPoint(h) → R
AI Drawing Prompt Reference
Draw the graph of the function y=2x+3 and find its vertex Q. Then draw the graph of the function y=(2x+3)(x-1)(x+3)/(x-1)(x+3) and find its vertex D. Next, draw the graph of the function y=x^2-2 and find its vertex R. Finally, draw the graph of the function y=2+1/(x-2) and find its vertex I.
The prompt above was compiled from the original drawing commands and is for reference only.