
Finding the Mean of Grouped Data - Section 1.1
Loading the math board and drawing, please wait…
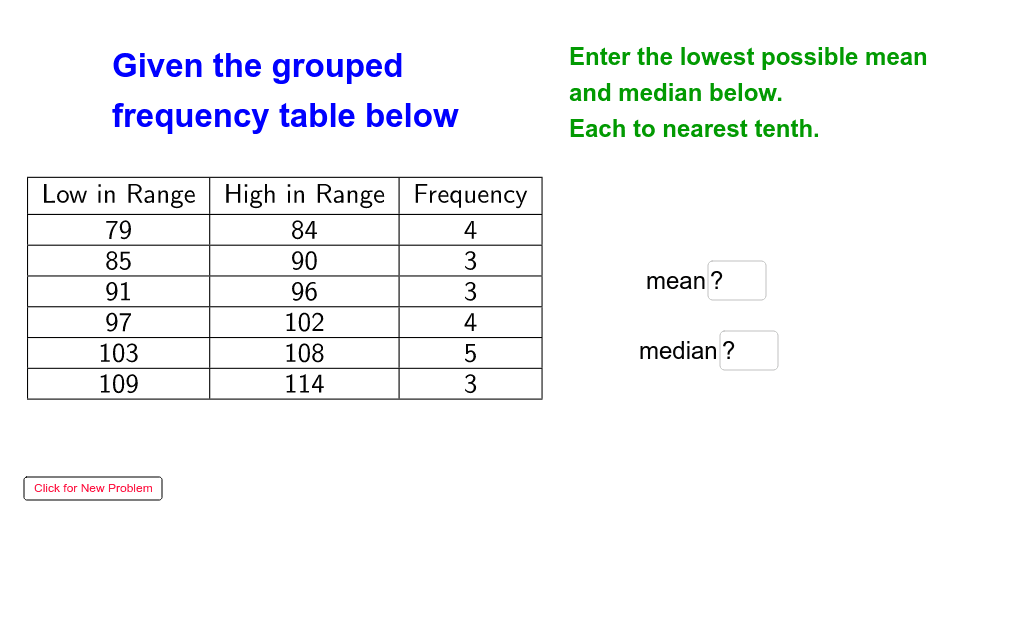
This GeoGebra example demonstrates how to compute the mean of grouped data with an interactive visualization. It focuses on the concept of frequency distributions and weighted averages, showing how the mean is calculated from class intervals and frequencies. The construction uses commands such as Random, Sequence, Join, If, Mean, Median, and TableText to generate random grouped data, build frequency tables, and display results dynamically. Interactive elements like Textfield, Button, and sliders allow users to change parameters (e.g., group size, random seed) and immediately see the effect on the mean and median. This resource is ideal for middle or high school statistics lessons, helping students grasp the formula for grouped data mean, compare it with the median, and explore how data grouping affects statistical measures. It also enhances skills in using dynamic mathematics software for data analysis.
GeoGebra Commands & Parameters
Random(4, 7) → lsizeRandom(2, 6) → stepRandom(20, 100) → seedJoin({{"Low in Range"}, Sequence[seed + (i * step), i, 1, lsize]}) → lowlistJoin({{"Frequency"}, Sequence[Random[2, 5], i, 1, lsize]}) → freqlistSequence(Sequence[Element[lowlist, i], j, 1, Element[freqlist, i]], i, 2, lsize + 1) → lowdataJoin(lowdata) → loweachMedian(loweach) → lowmedRandom(1, 2) → lhMean(loweach) → lowmeanRandom(10, 30) → aspanJoin({{"Low"}, Sequence[Random[seed, seed + aspan], i, 1, lsize]}) → dlistIf(lh ≟ 1, lowmean, highmean) → cmeaneIf(lh ≟ 1, lowmed, highmed) → cmedTextfield(gmean) → inputBox1Textfield(gmed) → inputBox2Join({{"High in Range"}, Sequence[seed + (i * step) - 1, i, 2, lsize + 1]}) → highlistTableText({lowlist, highlist, freqlist}, "vc|_") → text8If(lh ≟ 1, "lowest possible", "highest possible") → lhtext
AI Drawing Prompt Reference
This is a statistical visualization example showing how to compute the mean of grouped data. The graph includes a random data list, a frequency table, a median and mean, and a text box for input. Users can adjust parameters to observe changes in the mean and median. The graph aims to help students understand concepts of grouped data and statistical measures.
The prompt above was compiled from the original drawing commands and is for reference only.