
Finding Function Values Using Inverse Graphs
Loading the math board and drawing, please wait…
In collections
UCSS Secondary Math III Unit 4A Lesson 1
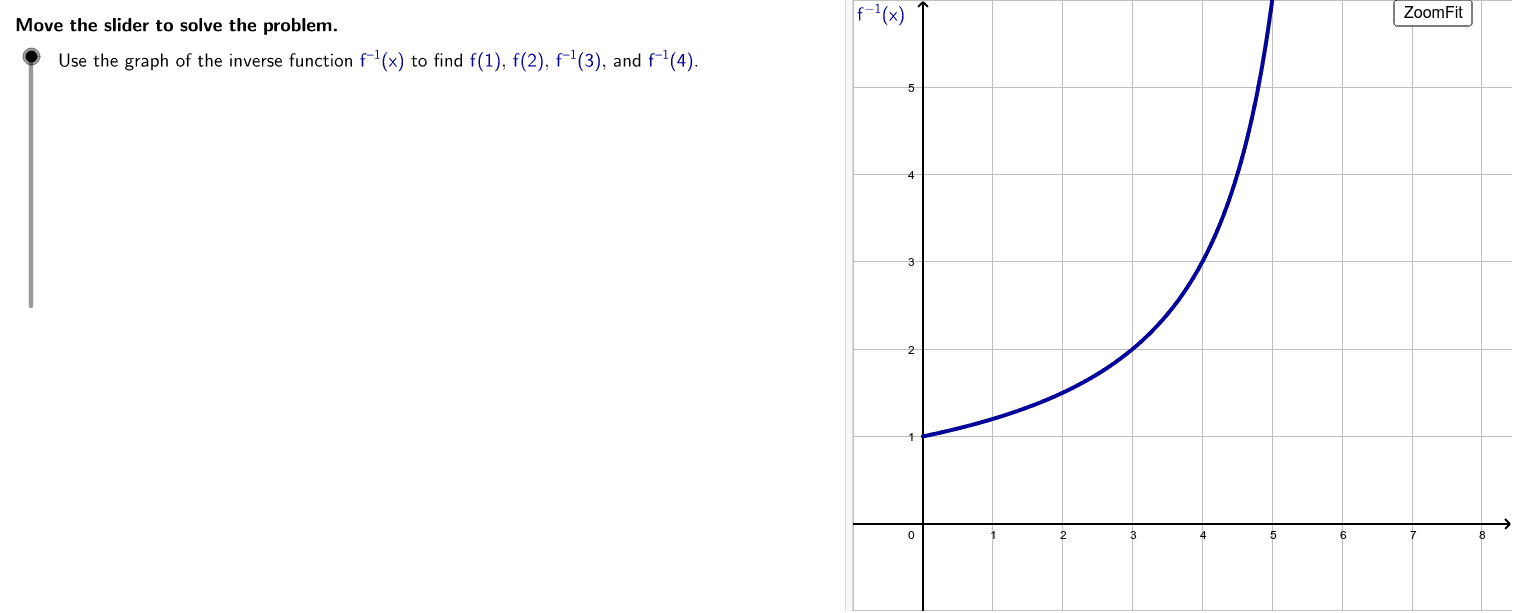
This example demonstrates how to find function values and inverse function values by graphing the inverse function. Key math concepts include inverse functions, symmetry of function graphs, and coordinate point correspondence. GeoGebra commands like LaTeX, Corner, If, Vector, and objects such as stepMax, stepper, etc., are used to dynamically display and calculate. Suitable for high school students learning about function properties and inverse functions.
GeoGebra Commands & Parameters
LaTeX(steps) → counterLaTeX("\text{Move the slider to solve the problem.}") → text0Corner(1) → ACorner(3) → BIf(set ≟ 1, If[0 ≤ x ≤ 6,-6 / (x - 6)], If[set ≟ 2, If[6 ≤ x ≤ 12,-6 / (x - 6)], If[set ≟ 3, If[-6 ≤ x ≤ 0,6 / (x + 6)], If[-12 ≤ x ≤ -6,6 / (x + 6)]]]) → inverseIf(set ≟ 1, -1, If[set ≟ 2, -7, If[set ≟ 3, -1, -7]]) → yminLaTeX("\textcolor{#000099}{f^{-1}(x)}") → labelIf(set ≟ 1, 1, If[set ≟ 2, -6, If[set ≟ 3, 6, -2]]) → v1If(set ≟ 1, 2, If[set ≟ 2, -1, If[set ≟ 3, 2, -3]]) → v2If(set ≟ 1, 3, If[set ≟ 2, 8, If[set ≟ 3, -3, -12]]) → v3If(set ≟ 1, 4, If[set ≟ 2, 9, If[set ≟ 3, -4, -9]]) → v4If(set ≟ 1, 0, If[set ≟ 2, 7, If[set ≟ 3, -5, -9]]) → m1If(set ≟ 1, 3, If[set ≟ 2, 12, If[set ≟ 3, -3, -8]]) → m2If(set ≟ 1, 2, If[set ≟ 2, -3, If[set ≟ 3, 2, -1]]) → m3If(set ≟ 1, 3, If[set ≟ 2, 2, If[set ≟ 3, 3, -2]]) → m4If(set ≟ 1, (0, 1), If[set ≟ 2, (0, -6), If[set ≟ 3, (0, 6), (0, -2)]]) → pstart1If(set ≟ 1, (0, 2), If[set ≟ 2, (0, -1), If[set ≟ 3, (0, 2), (0, -3)]]) → pstart2If(set ≟ 1, (3, 0), If[set ≟ 2, (8, 0), If[set ≟ 3, (-3, 0), (-12, 0)]]) → pstart3If(set ≟ 1, (4, 0), If[set ≟ 2, (9, 0), If[set ≟ 3, (-4, 0), (-9, 0)]]) → pstart4If(set ≟ 1, (0, 0), If[set ≟ 2, (7, 0), If[set ≟ 3, (-5, 0), (-9, 0)]]) → pend1If(set ≟ 1, (3, 0), If[set ≟ 2, (12, 0), If[set ≟ 3, (-3, 0), (-8, 0)]]) → pend2If(set ≟ 1, (0, 2), If[set ≟ 2, (0, -3), If[set ≟ 3, (0, 2), (0, -1)]]) → pend3If(set ≟ 1, (0, 3), If[set ≟ 2, (0, -2), If[set ≟ 3, (0, 3), (0, -2)]]) → pend4If(set ≟ 1, (0, 1), If[set ≟ 2, (7, -6), If[set ≟ 3, (-5, 6), (-9, -2)]]) → p1If(set ≟ 1, (3, 2), If[set ≟ 2, (12, -1), If[set ≟ 3, (-3, 2), (-8, -3)]]) → p2If(set ≟ 1, (3, 2), If[set ≟ 2, (8, -3), If[set ≟ 3, (-3, 2), (-12, -1)]]) → p3If(set ≟ 1, (4, 3), If[set ≟ 2, (9, -2), If[set ≟ 3, (-4, 3), (-9, -2)]]) → p4Vector(pstart1, p1) → trace1aVector(pstart2, p2) → trace2aVector(pstart3, p3) → trace3aVector(pstart4, p4) → trace4aVector(p1, pend1) → trace1bVector(p2, pend2) → trace2bVector(p3, pend3) → trace3bVector(p4, pend4) → trace4bLaTeX("\text{Move left or right to the graph of }\textcolor{#000099}{f^{-1}(x)}.") → text5If(set ≟ 1, 0, If[set ≟ 2, 7, If[set ≟ 3, -5, -9]]) → m1_1LaTeX("\text{Move left or right to the graph of }\textcolor{#000099}{f^{-1}(x)}.") → text11If(set ≟ 1, -1, If[set ≟ 2, -1, If[set ≟ 3, -7, -13]]) → xminIf(set ≟ 1, 7, If[set ≟ 2, 13, If[set ≟ 3, 1, 1]]) → xmaxIf(set ≟ 1, (6, inverse(6)), If[set ≟ 2, (7, inverse(7)), If[set ≟ 3, ((-5), inverse((-5))), (-9, -2)]]) → CIf(set ≟ 1, 6, If[set ≟ 2, 1, If[set ≟ 3, 7, 1]]) → ymaxLaTeX("\text{Use the buttons below to return to the original problem or}\cr\text{randomly generate a similar practice problem.}") → RandomizationTextLaTeX((("\text{Find the function value }\textcolor{#000099}{f(" * v1) * ")}\text{ from the graph of the inverse function }\textcolor{#000099}{f^{–1}(x)}.")) → text1LaTeX((((((((("\text{Use the graph of the inverse function }\textcolor{#000099}{f^{–1}(x)}\text{ to find }\textcolor{#000099}{f(" * v1) * ")}\text{, }\textcolor{#000099}{f(") * v2) * ")}\text{, }\textcolor{#000099}{f^{–1}(") * v3) * ")}\text{, and }\textcolor{#000099}{f^{–1}(") * v4) * ")}.")) → ProblemLaTeX((((("\text{To find the value of }\textcolor{#000099}{f(x)}\text{ at }\textcolor{#000099}{x = " * v1) * "}\text{ from the graph of the inverse function }\textcolor{#000099}{f^{–1}(x)},\cr\text{locate the value }\textcolor{#000099}{") * v1) * "}\text{ on the }\textcolor{#000099}{y}\text{-axis of the graph.}")) → text4LaTeX("\text{Now move up or down from the point on the graph to the }\textcolor{#000099}{x}\text{-axis.}") → text6LaTeX((((("\text{The }\textcolor{#000099}{x}\text{-coordinate, }\textcolor{#000099}{" * m1) * "}\text{, where this vertical line hits the }\textcolor{#000099}{x}\text{-axis represents the output }\cr\text{value of }\textcolor{#000099}{f(x)}\text{ at an input value of }\textcolor{#000099}{x=") * v1) * "}.")) → text7LaTeX((("\text{Find the function value }\textcolor{#000099}{f(" * v2) * ")}\text{ from the graph of the inverse function }\textcolor{#000099}{f^{–1}(x)}.")) → text9LaTeX((((("\text{To find the value of }\textcolor{#000099}{f(x)}\text{ at }\textcolor{#000099}{x = " * v2) * "}\text{ from the graph of the inverse function }\textcolor{#000099}{f^{–1}(x)},\cr\text{locate the value }\textcolor{#000099}{") * v2) * "}\text{ on the }\textcolor{#000099}{y}\text{-axis of the graph.}")) → text10LaTeX("\text{Now move up or down from the point on the graph to the }\textcolor{#000099}{x}\text{-axis.}") → text12LaTeX((((("\text{The }\textcolor{#000099}{x}\text{-coordinate, }\textcolor{#000099}{" * m2) * "}\text{, where this vertical line hits the }\textcolor{#000099}{x}\text{-axis represents the output }\cr\text{value of }\textcolor{#000099}{f(x)}\text{ at an input value of }\textcolor{#000099}{x=") * v2) * "}.")) → text13LaTeX((("\text{Find the inverse function value }\textcolor{#000099}{f^{-1}(" * v3) * ")}\text{ from the graph of the inverse function }\textcolor{#000099}{f^{–1}(x)}.")) → text15LaTeX("\text{Remember that this is a graph of the inverse function }\textcolor{#000099}{f^{–1}(x)}\text{, and not a graph of the }\cr\text{function }\textcolor{#000099}{f(x)}\text{. That means the values of the inverse function }\textcolor{#000099}{f^{–1}(x)}\text{ are read from the }\cr\text{graph in the usual way, with the }\textcolor{#000099}{x}\text{-axis as the input.}") → text16LaTeX((((("\text{To find the value of }\textcolor{#000099}{f^{–1}(x)}\text{ at }\textcolor{#000099}{x = " * v3) * "}\text{ from the graph, locate }\textcolor{#000099}{") * v3) * "}\text{ on the }\textcolor{#000099}{x}\text{-axis.}")) → text17LaTeX((("\text{Find the inverse function value }\textcolor{#000099}{f^{-1}(" * v4) * ")}\text{ from the graph of the {inverse function }\textcolor{#000099}{f^{–1}(x)}.")) → text20LaTeX((((("\text{To find the value of }\textcolor{#000099}{f^{–1}(x)}\text{ at }\textcolor{#000099}{x = " * v4) * "}\text{ from the graph, locate }\textcolor{#000099}{") * v4) * "}\text{ on the }\textcolor{#000099}{x}\text{-axis.}")) → text21LaTeX("\text{Notice that this is a graph of the inverse function }\textcolor{#000099}{f^{–1}(x)}\text{, and not a graph of the}\cr\text{function }\textcolor{#000099}{f(x)}\text{. Also remember that the inverse of }\textcolor{#000099}{f^{–1}(x)}\text{ is the original function }\textcolor{#000099}{f(x)}.") → text2LaTeX("\text{Because the inverse relationship between }\textcolor{#000099}{f(x)}\text{ and }\textcolor{#000099}{f^{–1}(x)}\text{ goes both ways, you can use}\cr\text{the graph of the inverse function }\textcolor{#000099}{f^{–1}(x)}\text{ to find values of the original function }\textcolor{#000099}{f(x)}.") → text3LaTeX((((("\text{Therefore, }\textcolor{#000099}{f(" * v1) * ")=") * m1) * "}.")) → text8LaTeX((((("\text{That is, }\textcolor{#000099}{f(" * v2) * ")=") * m2) * "}.")) → text14LaTeX((((((("\text{Then find the point on the function directly above or below }\textcolor{#000099}{x = " * v3) * "}\text{;}\cr\text{in this case, }\textcolor{#000099}{(") * v3) * ", ") * m3) * ")}.")) → text18LaTeX((((((((("\text{The }\textcolor{#000099}{y}\text{-coordinate, }\textcolor{#000099}{" * m3) * "}\text{, of this point is the value of }\textcolor{#000099}{f^{–1}(x)}\text{ at }\textcolor{#000099}{x = ") * v3) * "}\text{.}\cr\text{Therefore, }\textcolor{#000099}{f^{–1}(") * v3) * ") = ") * m3) * "}.")) → text19LaTeX((((((("\text{Then find the point on the function directly above or below }\textcolor{#000099}{x = " * v4) * "}\text{;}\cr\text{in this case, }\textcolor{#000099}{(") * v4) * ", ") * m4) * ")}.")) → text22LaTeX((((((((("\text{The }\textcolor{#000099}{y}\text{-coordinate, }\textcolor{#000099}{" * m4) * "}\text{, of this point is the value of }\textcolor{#000099}{f^{–1}(x)}\text{ at }\textcolor{#000099}{x = ") * v4) * "}\text{.}\cr\text{Therefore, }\textcolor{#000099}{f^{–1}(") * v4) * ") = ") * m4) * "}.")) → text23
AI Drawing Prompt Reference
Draw a function and its inverse function to demonstrate how to find function values using the inverse graph. Key objects include the function graph, inverse function graph, coordinate axes, and several key points. First, plot the function graph, then the inverse function graph, and label the inverse function. Next, use several key points to show how to find corresponding function values from the inverse function graph, including intersections with the coordinate axes and the position of vertical lines. Finally, dynamically display a slider and text explanations to clarify how to find function values using the inverse function graph.
The prompt above was compiled from the original drawing commands and is for reference only.