
Find the Selling Price: Interactive Percentage-Based Pricing Model
Loading the math board and drawing, please wait…
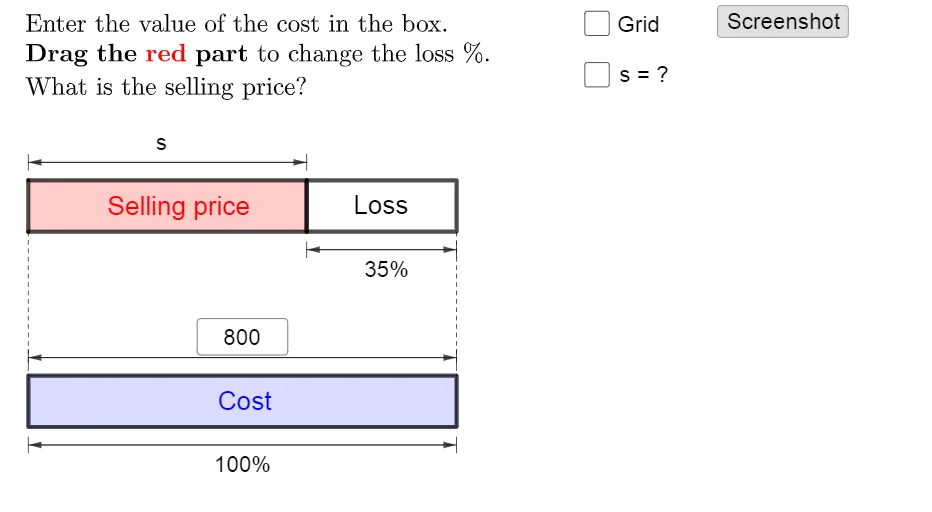
This GeoGebra example demonstrates how to calculate the selling price from cost and profit rate through an interactive interface, applying percentage concepts in a business context. The core mathematical ideas involve percentage operations, linear relationships, and algebraic equation solving. Construction highlights: the model uses commands such as If, Point, Polygon, Sequence, Textfield, Segment, and Vector to build dynamic visuals, with InputBoxes for entering cost and profit rate, and Text objects to display the computed price in real time. Suitable for middle school to high school students learning percentages, algebraic modeling, or commercial mathematics, as well as for teachers demonstrating the formula Selling Price = Cost × (1 + Profit Rate) in an engaging way.
GeoGebra Commands & Parameters
If(a, "d", ((If[p ∧ x(P) < 10, "-"] * abs(d)) * "")) → dtextIf(c', "c", (n * "")) → ntextPoint(yAxis) → APoint(yAxis) → BIf(x(P) ≤ 10, A + (10, 0), B + (10, 0)) → A0If(x(P) ≤ 10, P, (x(P), y(B))) → P0Polygon(P, Q, (0, y(Q)), (0, y(P))) → q1, p_1, q_1, g, hPolygon({P0, A0, A0 + (0, 1), P0 + (0, 1)}) → q2Polygon({B, B + (10, 0), B + (10, 1), B + (0, 1)}) → q3Polygon({B, B + (10, 0), B + (10, 1), B + (0, 1)}) → q4Sequence(Segment[B + (i, 0), B + (i, 1)], i, 1, 9, 1) → l1Sequence(Sequence[Segment[B + (j + i, 0), B + (j + i, 1)], j, 0, 9, 1], i, 0.1, 0.9, 0.1) → l2Sequence(Segment[A + (i, 0), A + (i, 1)], i, 1, 9, 1) → l3Sequence(Sequence[Segment[A + (j + i, 0), A + (j + i, 1)], j, 0, 9, 1], i, 0.1, 0.9, 0.1) → l4Textfield(n) → InputBox1Textfield(m) → InputBox2If(b, "s", (m * "")) → mtextSegment(If[b_1 ≟ 0, A, A0] + (0, 1.2), If[b_1 ≟ 0, A, A0] + (0, 1.5)) → iSegment(If[b_1 ≟ 0, P, P0] + (0, 1.2), If[b_1 ≟ 0, P, P0] + (0, 1.5)) → jVector(Midpoint[i], Midpoint[j]) → uVector(Midpoint[j], Midpoint[i]) → vSegment(A0 - (0, 0.2), A0 - (0, 0.5)) → kSegment(P0 - (0, 0.2), P0 - (0, 0.5)) → lVector(Midpoint[k], Midpoint[l]) → wVector(Midpoint[l], Midpoint[k]) → eSegment(B + (0, 1.2), B + (0, 1.5)) → fSegment(B + (10, 1.2), B + (10, 1.5)) → rVector(Midpoint[f], Midpoint[r]) → sVector(Midpoint[r], Midpoint[f]) → tSegment(B - (0, 0.2), B - (0, 0.5)) → f_1Segment(B + (10, -0.2), B + (10, -0.5)) → g_1Vector(Midpoint[f_1], Midpoint[g_1]) → u_1Vector(Midpoint[g_1], Midpoint[f_1]) → v_1If(a, "d", If[b, If[b_1 ≟ 0, "s", "x"], "c"]) → text12Sequence(Segment[A + (10 + i, 0), A + (10 + i, 1)], i, 0.1, x(P) - 10, 0.1) → l6Sequence(Segment[A + (10 + i, 0), A + (10 + i, 1)], i, 0, floor(x(P) - 10)) → l5Sequence(Segment[A0 + (i, 0), A0 + (i, 1)], i, 0, floor(x(P0) - 10)) → l7Sequence(Segment[A0 + (i, 0), A0 + (i, 1)], i, 0.1, x(P0) - 10, 0.1) → l8If(p, m - n, abs(n - m)) → cSegment(If[x(P) ≤ 10, A + (10, 0), P], If[x(P) ≤ 10, B + (10, 1), x(P)]) → h_1Segment(A, B + (0, 1)) → i_1Segment(A - (0, 0.2), A - (0, 0.5)) → j_1Segment(P - (0, 0.2), P - (0, 0.5)) → k_1Vector(Midpoint[k_1], Midpoint[j_1]) → w_1Vector(Midpoint[j_1], Midpoint[k_1]) → c_1Segment(A0 + (0, 1.2), A0 + (0, 1.5)) → k'Segment(P0 + (0, 1.2), P0 + (0, 1.5)) → l'Vector(Midpoint[k'], Midpoint[l']) → e_1Vector(Midpoint[l'], Midpoint[k']) → l_1If(p, "Change", If[x(P) < 10, "Loss", If[x(P) > 10, "Profit", ""]]) → change
AI Drawing Prompt Reference
Create a graph showing how cost and profit rate affect the selling price. Start by drawing two vertical lines as the y-axis. Then, draw a point P on the x-axis to represent the cost. Draw another point P0 to represent the position of P when x is greater than 10. Use these points to draw a quadrilateral representing the relationship between cost and selling price. Draw two points A and B on the y-axis to represent the starting points of cost and selling price. Then, draw a series of vertical and horizontal line segments to form a grid, representing changes in cost and selling price. Draw two slanted lines to represent the cost and selling price lines. Finally, use text boxes to input cost and profit rate, calculate, and display the selling price.
The prompt above was compiled from the original drawing commands and is for reference only.