
Find Slope from Two Points
Loading the math board and drawing, please wait…
In collections
Slope
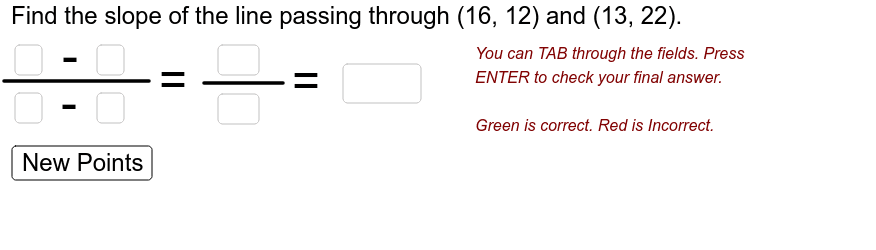
This example demonstrates how to calculate the slope of a line through two points. The core math concept involved is the slope calculation formula in analytical geometry. Key construction elements include GeoGebra commands like Shuffle, Element, Textfield, Segment, GCD, If, and objects such as list1, y_1, x_1, x_2, y_2, etc. By inputting the coordinates of two points and calculating the difference in their y-coordinates and x-coordinates, the slope is determined. Suitable for high school mathematics teaching and learning analytical geometry.
GeoGebra Commands & Parameters
Shuffle(Sequence[i, i, -30, 30]) → list1Element(list1, 3) → y_1Element(list1, 1) → x_1Element(list1, 2) → x_2Element(list1, 4) → y_2Textfield(y2text) → inputBox1Textfield(y1text) → inputBox2Segment(A, B) → aTextfield(x2text) → inputBox3Textfield(x1text) → inputBox4Segment(C, D) → bTextfield(risetext) → inputBox5Textfield(runtext) → inputBox6GCD(abs(rise_1), abs(run_1)) → gcf_mIf(m < 0, "-", "") → sign_mTextfield(ans) → inputBox7
AI Drawing Prompt Reference
Create a teaching diagram for finding the slope of a line through two points. Randomly select four integer coordinates on a coordinate plane, representing the x and y values of two points. Display four input boxes for entering these coordinates. Connect the two points with a segment, and label the vertical change (rise) and horizontal change (run) near the segment. Below, show a calculation area with input boxes for rise, run, and a result box for the slope. The slope is displayed as a simplified fraction, with a negative sign if applicable. The layout is clear, suitable for high school analytic geometry.
The prompt above was compiled from the original drawing commands and is for reference only.