
Filling a Cone: Dynamic Water Level and Volume Simulation
Loading the math board and drawing, please wait…
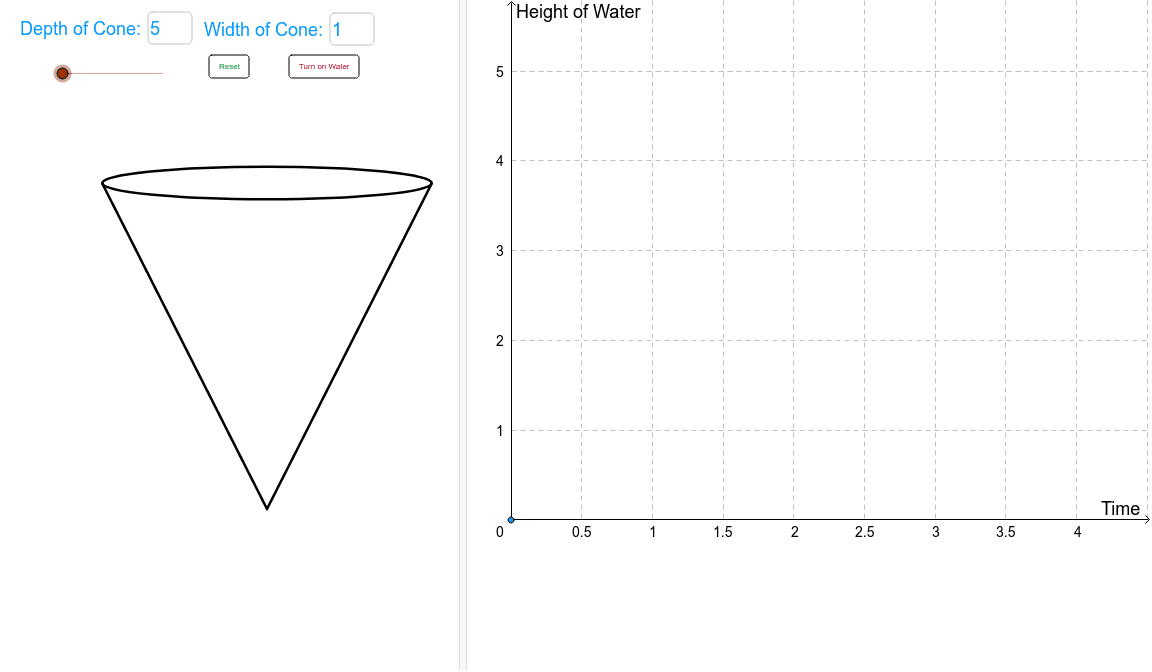
① This GeoGebra example dynamically simulates filling a conical container with water, visually demonstrating how the water level rises over time and how the surface area and volume change. ② Core mathematical concepts include the cone volume formula, proportional relationships, function graphs (water height vs. fill amount), and interactive elements like sliders and input fields. ③ Construction highlights: commands such as Tangent, Function, and Polygon are used to build the cone's side and base; Textfield and input boxes (inputBox1, inputBox2, inputBox3) control fill parameters; sliders (depth, width, radius) adjust cone dimensions; buttons (button1, button2) trigger the filling animation; Polygon and point objects (P1, watertopfill) render the water surface. ④ Suitable for middle and high school geometry and algebra lessons, especially for understanding cone volume formulas, function modeling, and the power of dynamic visualization in mathematics education.
GeoGebra Commands & Parameters
Tangent(Apex, top) → a, bFunction(-(x(b) / y(b)) * x - z(b) / y(b), x(Apex) - radius, x(Apex)) → lhsFunction(-(x(a) / y(a)) * x - z(a) / y(a), x(Apex), x(Apex) + radius) → rhsPolygon(Apex, (x(Apex) + wwidth, wheight), (x(Apex) - wwidth, wheight)) → poly1, d, apex, eTextfield(depth) → inputBox1Textfield(width) → inputBox2Textfield(tapwater) → inputBox3Polygon(Apex, (x(Apex) + width / 2, depth), (x(Apex) - width / 2, depth)) → poly2, c, f, g