
Fehr Problem 9 GeoGebra Visualization
Loading the math board and drawing, please wait…
In collections
Phantom Graphs
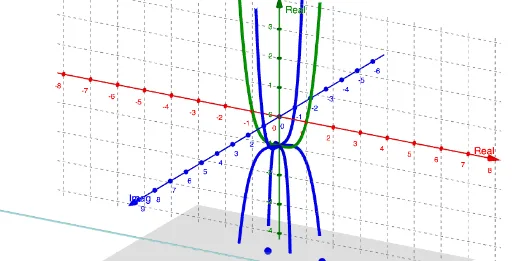
This example demonstrates the graphical representation of Fehr Problem 9, involving curve sketching, integers, tangent functions, equilateral triangles, and scatter plots. It leverages GeoGebra commands like ComplexRoot and CurveCartesian to construct the visualization. Ideal for high school and advanced mathematics learners to explore complex function graphs and geometric interactions.
GeoGebra Commands & Parameters
ComplexRoot(f(x) - c) → z_1, z_2, z_3, z_4CurveCartesian(0, t^(4) - 1, t, t, -25, 25) → bCurveCartesian(t, (-4 * t^(4)) - 1, t, t, -25, 25) → dCurveCartesian(t, (-4 * t^(4)) - 1, (-t), t, -25, 25) → e