
Exponential vs Linear Functions Comparison
Loading the math board and drawing, please wait…
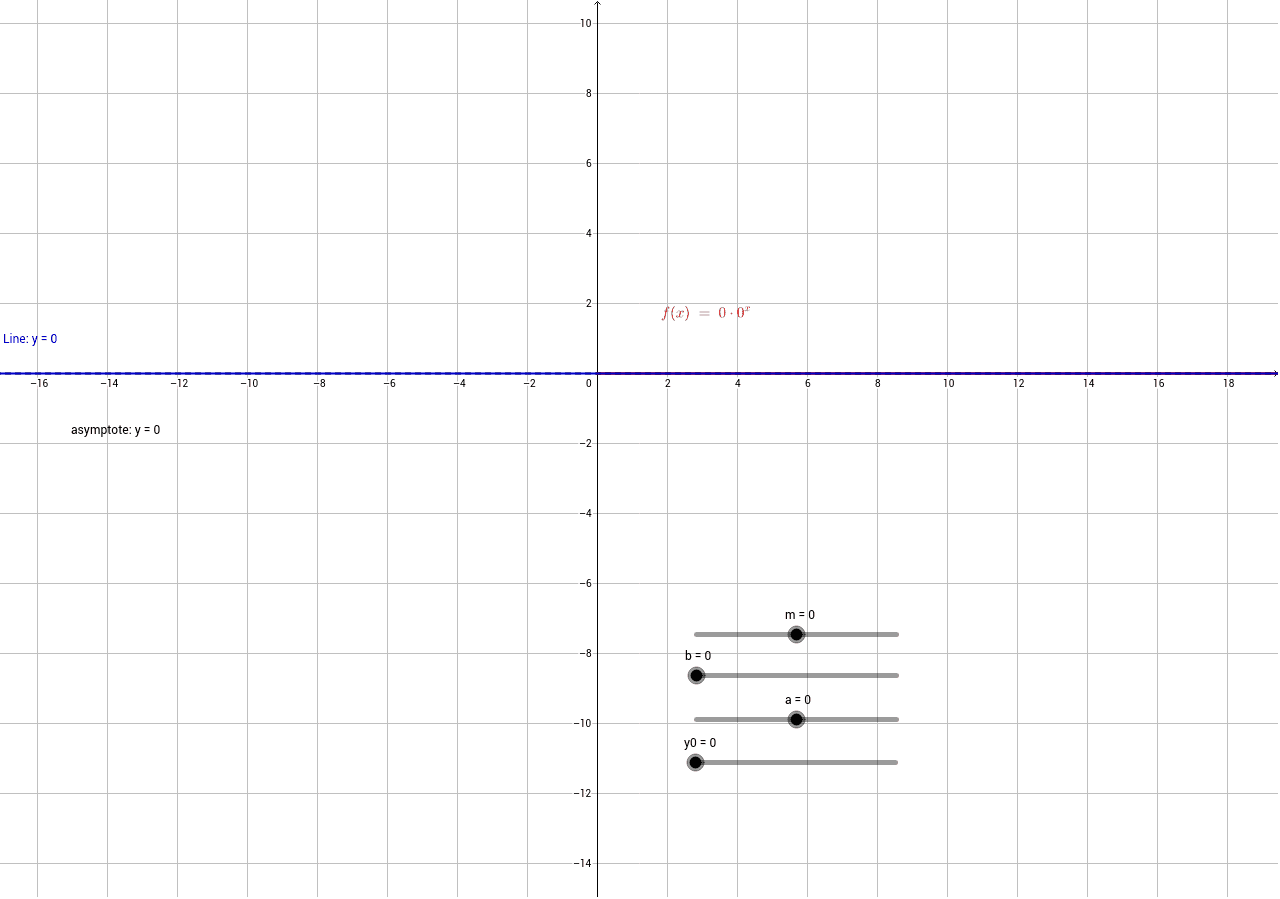
① This example demonstrates a side‑by‑side plot of an exponential function and a linear function, highlighting their different growth rates. ② Core concepts: exponential base, horizontal asymptote, initial value; linear slope and intercept; translation and scaling of function graphs. ③ Construction highlights: sliders a and b control the exponential base and coefficient, slider y0 sets the initial value, asymptote draws the horizontal asymptote, f defines the exponential expression, m sets the linear slope, and Line draws the linear graph. ④ Suitable for high‑school function‑graph lessons and introductory college calculus demonstrations.
GeoGebra Commands & Parameters
Numeric a(0)Numeric b(0)Numeric y0(0)y = af(x) = (y0 * b^(x)) + aNumeric m(0)y = (m * x) + b
AI Drawing Prompt Reference
Plot an exponential function and a linear function side by side. The base of the exponential function is controlled by slider a, the initial value by slider y0, and the slope of the linear function by slider m. Show their growth differences and the horizontal asymptote of the exponential function.
The prompt above was compiled from the original drawing commands and is for reference only.