
Exponential–Logarithmic Inverse Mapping with Slope/ Difference Visualization
Loading the math board and drawing, please wait…
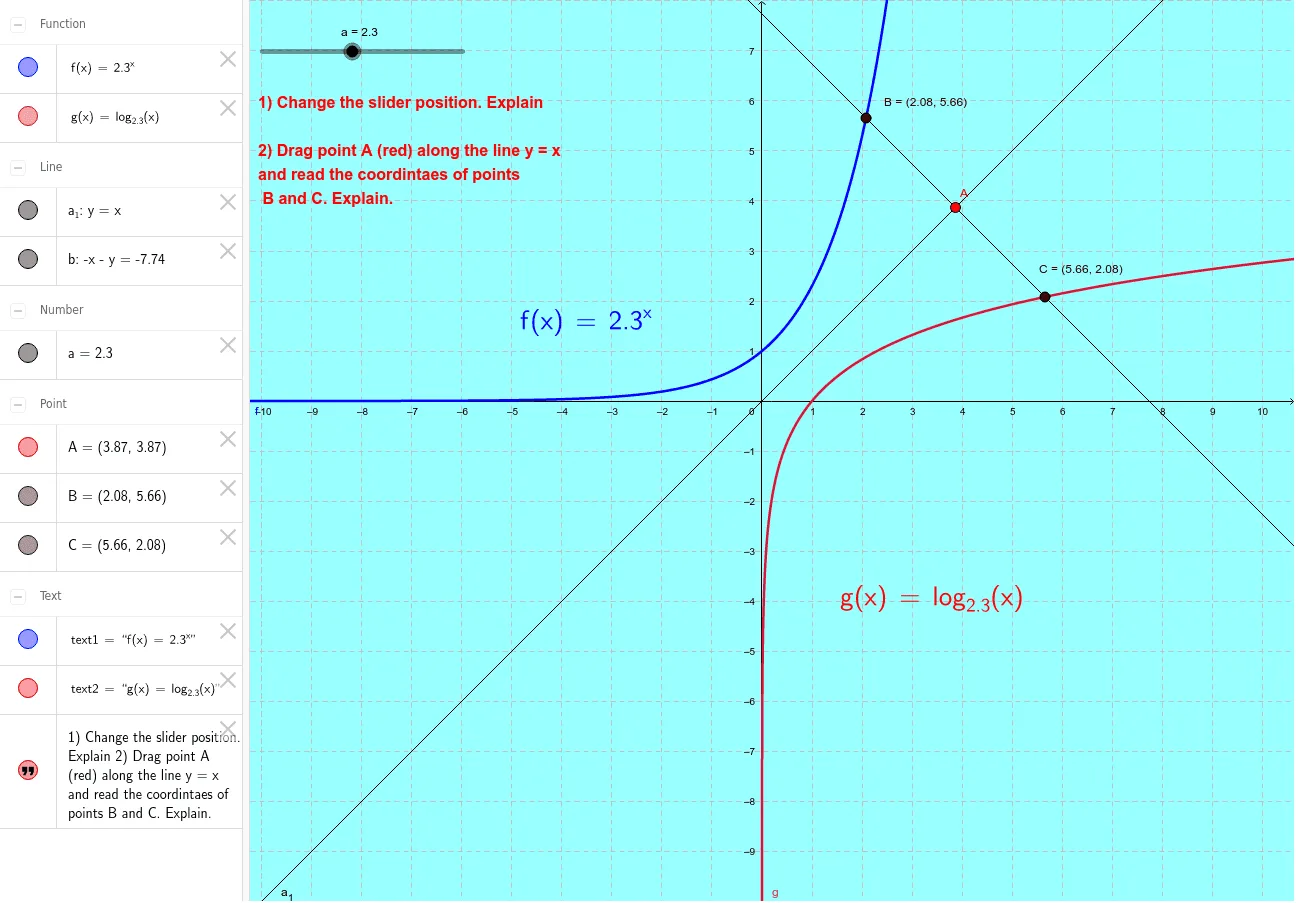
This GeoGebra example demonstrates the inverse relationship between exponential and logarithmic functions by constructing corresponding geometric features and highlighting how values change locally. It centers on key ideas such as exponential/logarithmic functions as mutual inverses, the “difference and slope” viewpoint for understanding how a function varies near a point, and slope-related intuition that supports later study in calculus. Construction highlights include using Invert to create inverse (corresponding) mappings, LaTeX to label derived expressions (text1/text2/text3), Point to place key reference points (a, a_1, A, b, B, C), Intersect to compute intersection points that form the visual relationships, and OrthogonalLine to draw perpendicular lines used in the geometric slope/direction interpretation. Suitable for secondary advanced students and early university learners, especially for graphing, inverse functions, and pre-calculus intuition before formal derivatives.
GeoGebra Commands & Parameters
Invert(f) → gLaTeX(f, true, true) → text1LaTeX(g, true, true) → text2Point(a_1) → AOrthogonalLine(A, a_1) → bIntersect(f, b, (2.080963662644601, 5.659036336288265)) → BIntersect(g, b, (5.659036337168624, 2.0809636628313766)) → C
AI Drawing Prompt Reference
Draw a graph showing the relationship between an exponential function and a logarithmic function. Include the graphs of both functions, their intersection points, and a line perpendicular to the exponential function's graph. Mark the intersection points to illustrate local changes and slopes. Focus on understanding the mutual inverse relationship and the concept of difference and slope in pre-calculus.
The prompt above was compiled from the original drawing commands and is for reference only.