
Exponential Growth & Spreadsheet
Loading the math board and drawing, please wait…
In collections
Geom. & Alg.: Exponential Functions & Logarithms
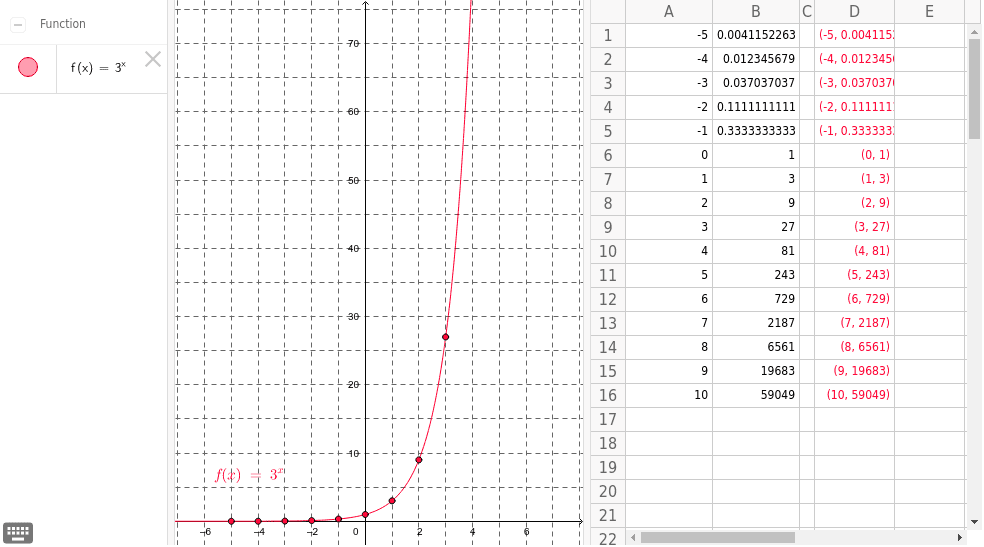
This example demonstrates the graphical representation and calculation of an exponential growth model. Key math concepts include exponential functions, data visualization, and spreadsheet applications. Construction involves using GeoGebra commands to create multiple points (A1-A16, B1-B16, D1-D8) for simulating data growth and chart plotting. Suitable for high school mathematics and introductory statistics, helping students understand exponential growth patterns and data processing techniques.
GeoGebra Commands & Parameters
Numeric A1(-5.0)A1 + 1A2 + 1A3 + 1A4 + 1A5 + 1A6 + 1A7 + 1A8 + 1A9 + 1A10 + 1A11 + 1A12 + 1A13 + 1A14 + 1A15 + 13^(A1)3^(A2)3^(A3)3^(A4)3^(A5)3^(A6)3^(A7)3^(A8)3^(A9)3^(A10)3^(A11)3^(A12)3^(A13)3^(A14)3^(A15)3^(A16)(A1, B1)(A2, B2)(A3, B3)(A4, B4)(A5, B5)(A6, B6)(A7, B7)(A8, B8)(A9, B9)(A10, B10)(A11, B11)(A12, B12)(A13, B13)(A14, B14)(A15, B15)(A16, B16)f(x) = 3^(x)
AI Drawing Prompt Reference
Draw a graph showing exponential growth, including a series of points starting from -5 with consecutive integer values, and corresponding exponential function values for each integer point, connect these points with a line to display the exponential growth trend.
The prompt above was compiled from the original drawing commands and is for reference only.