
Exponential Functions Modeling V1
Loading the math board and drawing, please wait…
In collections
Exponential & Logarithmic Functions
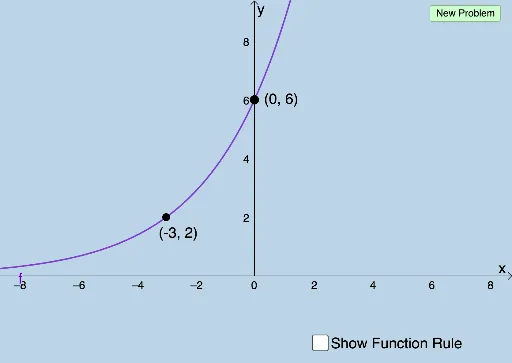
This example demonstrates how to use exponential functions to model exponential growth and decay phenomena. Core math concepts include exponential functions, function graphs, similarity transformation, and fitting. Using GeoGebra commands like Random, Sequence, Union, RandomElement, FitExp, and FitGrowth as outlined in the construction summary, it generates quiz questions with random y-intercepts. Suitable for high school students learning applications of exponential functions and data analysis.
GeoGebra Commands & Parameters
Random(1, 8) → nSequence(i, i, 1, n - 1, 1) → ylistunderSequence(i, i, n + 1, 8, 1) → ylistoverSequence(i, i, -8, m - 1) → xlistleftSequence(i, i, m + 1, 8, 1) → xlistrightUnion(ylistunder, ylistover) → ylistmasterUnion(xlistleft, xlistright) → xlistmasterRandomElement(xlistmaster) → cRandomElement(ylistmaster) → dFitExp({A, B}) → fFitGrowth({A, B}) → g
AI Drawing Prompt Reference
Draw a graph demonstrating exponential function modeling of growth, including randomly generated upper and lower y-value sequences and left and right x-value sequences, merge them to form complete x and y value sets, randomly select one x and one y as fitting points, fit an exponential function curve and a growth curve using these points, showing the graph of the exponential function and its fitting effect.
The prompt above was compiled from the original drawing commands and is for reference only.