
Exponential Functions - Gradient: Tangent Slope Visualization
Loading the math board and drawing, please wait…
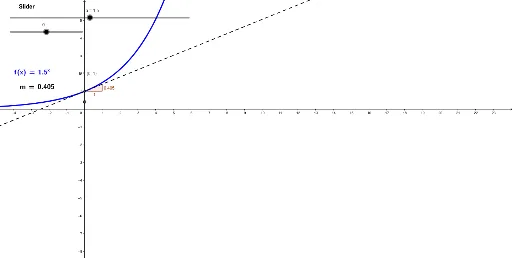
This GeoGebra example dynamically illustrates the slope of the tangent line at a movable point on an exponential function graph, revealing the geometric meaning of the derivative for exponential functions. Core mathematical concepts include exponential functions, derivatives (tangent slope), and dynamic point tracking on a curve. Construction highlights: the Tangent command creates the tangent line to the function f at point P, the Slope command computes and displays the slope value, and LaTeX text objects (text1, text2, text3) label the function expression, point coordinates, and slope. A draggable point or slider allows users to change the tangent position interactively. Suitable for high school or introductory college calculus students to explore derivative properties of exponential functions, and useful for classroom demonstrations or self-paced learning.
GeoGebra Commands & Parameters
Tangent(P, f) → bSlope(b) → mLaTeX(f, true, true) → text1LaTeX(m, true, true) → text2
AI Drawing Prompt Reference
Draw the graph of an exponential function. Place a draggable point on the curve. Construct the tangent line to the function at that point, and display the slope value of the tangent. Label the function expression, the point's coordinates, and the slope with text. As the point moves, the tangent line and slope update dynamically, illustrating the geometric meaning of the derivative for exponential functions.
The prompt above was compiled from the original drawing commands and is for reference only.