
Exponential Functions: Dynamic Exploration of Graphs and Related Concepts
Loading the math board and drawing, please wait…
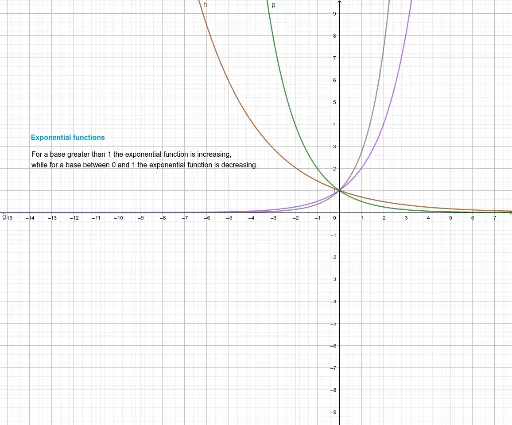
This GeoGebra example provides a dynamic visualization of exponential functions, integrating related concepts such as logarithmic functions, differential equations, and definite integrals. It demonstrates how the base of an exponential function affects its growth or decay, the inverse relationship between exponential and logarithmic functions, and the use of definite integrals to compute areas under exponential curves. The construction uses GeoGebra objects including functions f, g, h (likely representing exponential, logarithmic, and auxiliary functions), and text objects texto1 and texto2 to display dynamic expressions or values. Sliders or parameters may control the base, enabling interactive exploration. This resource is suitable for high school and early college students learning about exponential functions, their transformations, and their role in calculus, as well as for teachers seeking a visual aid for classroom demonstrations.
GeoGebra Commands & Parameters
f(x) = 2^(x)g(x) = ℯ^(x)h(x) = 0.7^(x)p(x) = 0.5^(x)
AI Drawing Prompt Reference
Draw three exponential function graphs: f(x)=2^x, g(x)=e^x, h(x)=0.7^x. Show the curves of these functions on a coordinate system and label them. You can adjust the transparency of the curves to compare them. Suitable for learning about exponential functions and their variations.
The prompt above was compiled from the original drawing commands and is for reference only.