
Exponential Functions Demo by naji ibrahim
Loading the math board and drawing, please wait…
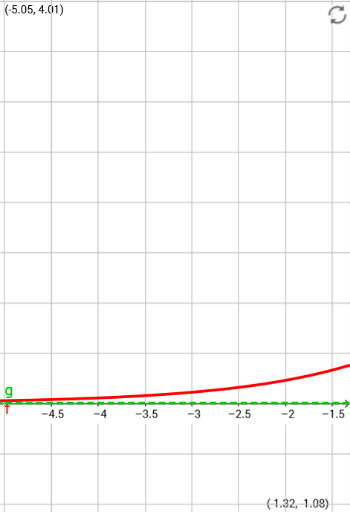
This example demonstrates the graph of exponential functions and their variation patterns. It involves core math concepts like exponential functions, function graphs, linear regression, and area calculation. Constructed using GeoGebra commands: Point for objects m, c, d, a, b, f, A, B, C, g. Suitable for high school mathematics teaching and function graph learning.
GeoGebra Commands & Parameters
Point(f) → APoint(f) → BPoint(f) → C
AI Drawing Prompt Reference
Draw the graph of an exponential function, and place three distinct points on the curve at different locations to illustrate how the function values change with the input. The graph should clearly show the exponential growth or decay pattern, with the three points marked to highlight the variation across intervals. The overall layout should be clean and suitable for high school math instruction on exponential functions.
The prompt above was compiled from the original drawing commands and is for reference only.