
Exponential Functions and e^x Graph
Loading the math board and drawing, please wait…
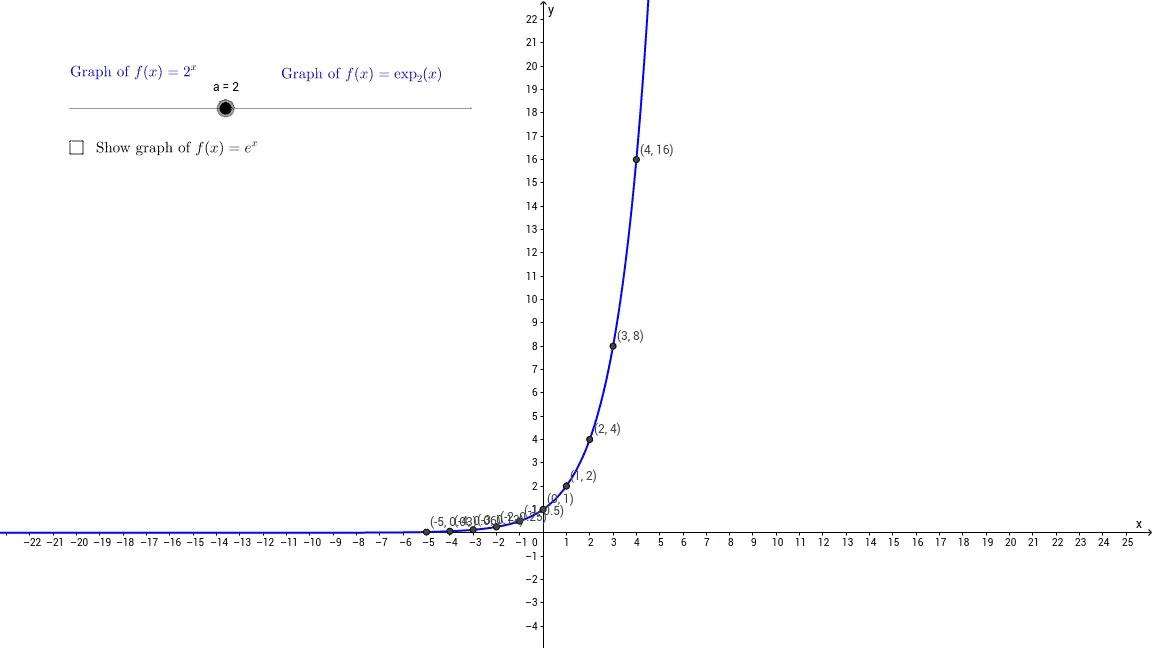
This example demonstrates the graph of the exponential function e^x and its variation patterns. Core math concepts include exponential functions, the natural logarithm base e, and the symmetry and growth characteristics of function graphs. GeoGebra commands/objects used: a, f, A, B, C, D, E, F, G, H, I, J, K, g, b, text2, text1_3, text1_1, text1, text1_2. Suitable for high school mathematics teaching, helping students understand the properties of exponential functions and the meaning of e, ideal for exploratory learning.
GeoGebra Commands & Parameters
Numeric a(2.0)f(x) = a^(x)(1, f(1))(2, f(2))(0, f(0))(3, f(3))(4, f(4))(5, f(5))(-1, f(-1))((-2), f((-2)))((-3), f((-3)))((-4), f((-4)))((-5), f((-5)))g(x) = ℯ^(x)Boolean b(false)