
Exponential Function Parameter Dependence Demo
Loading the math board and drawing, please wait…
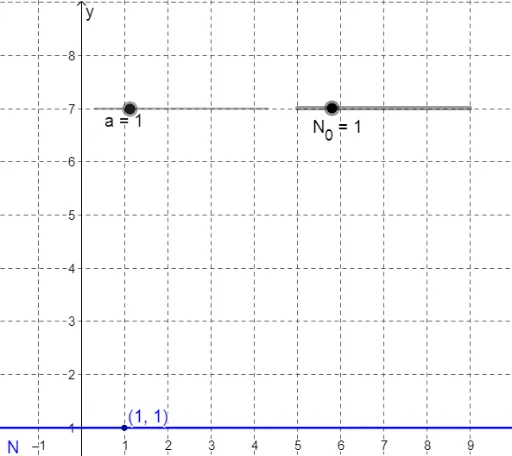
This example demonstrates the graphical behavior of the exponential function N=exp(a*t)+N0 as parameters a and N0 vary. Key math concepts include exponential functions, parametric equations, and function graphing. GeoGebra commands used: a (parameter), N0 (initial value), N (function value), A (locus). Suitable for high school and above mathematics learning to understand the impact of parameters on the function graph.
GeoGebra Commands & Parameters
Numeric a(1)Numeric N_0(1)N(x) = (N_0 * a^(x))(1, N(1))
AI Drawing Prompt Reference
Draw an exponential function graph to demonstrate the graphical behavior of N=exp(a*t)+N0 as parameters a and N0 vary. Use sliders to control the values of a and N0, and plot the function graph. Also, mark the function value at t=1 and show the locus of the function graph as parameters change.
The prompt above was compiled from the original drawing commands and is for reference only.