
Exponential Function Graph and Interest Calculation Demo
Loading the math board and drawing, please wait…
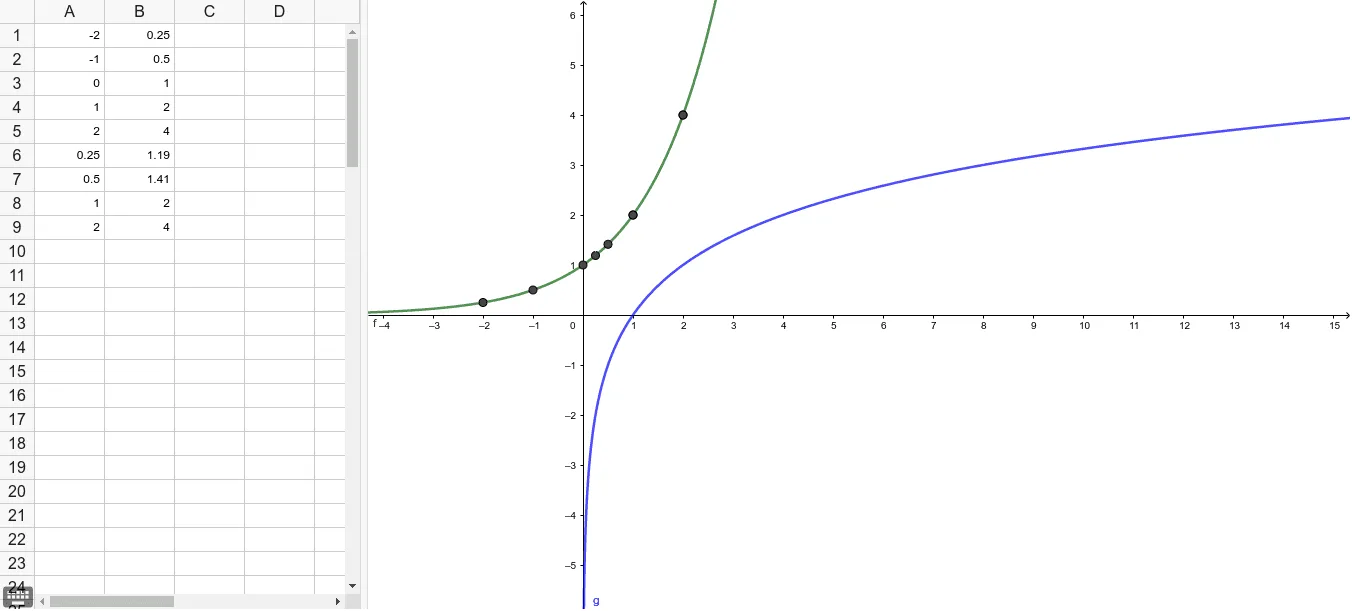
This GeoGebra example dynamically illustrates the graph of exponential functions and its application in interest calculation. The core mathematical concepts include exponential growth characteristics, the relationship between function graphs and coordinate axes, and the intuitive representation of compound interest using exponential models. Construction highlights: the function command defines exponential functions f and g; multiple point objects (A1 to A9, B1 to B9) mark key points on the curves; a line segment l1 connects selected points to show value changes; rectangle objects (A, B, C, D, E, F, G, H, I) help visualize discrete interest accumulation steps. Suitable for high school and early college students to understand the link between exponential functions and financial mathematics, and for teachers to demonstrate exponential growth and compound interest concepts in classroom settings.
GeoGebra Commands & Parameters
f: y = 2^(x)g: y = ld(x)-2-10120.250.5122^(A1)2^(A2)2^(A3)2^(A4)2^(A5)2^(A6)2^(A7)2^(A8)2^(A9)(A1, B1)(A2, B2)(A3, B3)(A4, B4)(A5, B5)(A6, B6)(A7, B7)(A8, B8)(A9, B9){A, B, C, D, E, F, G, H, I}
AI Drawing Prompt Reference
Draw a graph showing an exponential function and its application to interest calculation. First, plot the exponential curve y = 2^x, then plot its inverse logarithmic curve. On the exponential curve, mark a series of points with x-coordinates ranging from negative to positive, and compute their corresponding y-values. Connect two key points with a line segment to illustrate the change in value. Additionally, draw a set of rectangles arranged below or beside the curve to visually represent discrete steps of compound interest accumulation. The overall graph should clearly show exponential growth characteristics, the relationship between the function and the coordinate axes, and the application of the exponential model to interest calculation.
The prompt above was compiled from the original drawing commands and is for reference only.