
Exponential Function Exploration
Loading the math board and drawing, please wait…
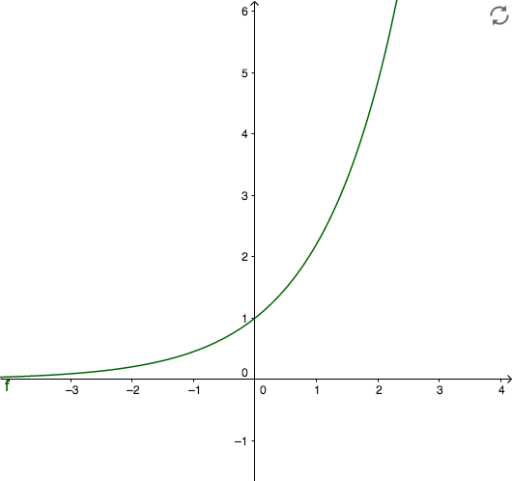
This example demonstrates the graph and properties of exponential functions. Key math concepts include the definition of exponential functions, graph transformations, and intersections with axes. It uses GeoGebra objects 'a' and 'f', allowing dynamic adjustments via sliders to observe changes in the function's graph. Suitable for high school students learning about exponential functions and their applications.
GeoGebra Commands & Parameters
Numeric a(2.2)f(x) = a^(x)
AI Drawing Prompt Reference
Draw a graph of an exponential function with a base controlled by a slider, initially set to about 2.2. The curve should be smooth, approaching the x-axis on the left without touching it, and rising steeply to the right. Include coordinate axes and grid lines to show the y-intercept at (0,1) and how the steepness changes with the base value. Keep the visualization clean and suitable for high school exploration of exponential functions.
The prompt above was compiled from the original drawing commands and is for reference only.