
Exponential Function Equation Writing Practice: From Graph Features to Form
Loading the math board and drawing, please wait…
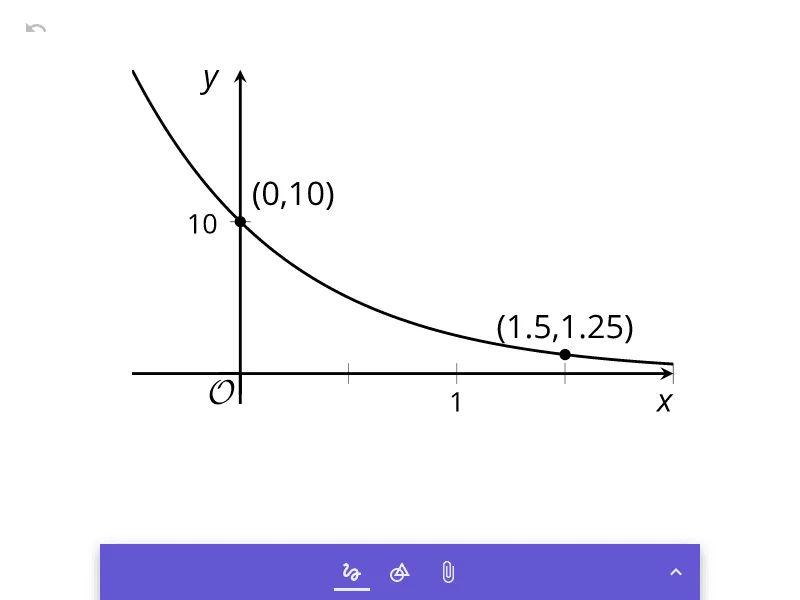
This example demonstrates how to write the equation of an exponential function from its graph characteristics, such as the horizontal asymptote, whether the function increases or decays, and one or more labeled points that determine the parameters. The key math concepts include the standard general form of an exponential function (e.g., f(x)=a·b^x+c), the roles of parameters a and b in scaling and growth/decay rate, and how horizontal/vertical shifts translate into the constants of the formula. Construction in GeoGebra typically involves entering the exponential function to visualize the curve, creating and placing reference points used to constrain parameters, and using sliders (when available) to adjust parameters and verify that the written equation matches the plotted graph. Suitable for secondary education and early high-school algebra and functions topics, focusing on building equations from graphical information and performing function modeling practice.
AI Drawing Prompt Reference
Draw an exponential function graph to demonstrate how to write its equation from its graph features, including the horizontal asymptote, increasing or decreasing trend, and labeled points to determine parameters. Use sliders to adjust parameters so the written equation matches the graph, showing the roles of parameters in scaling, growth/decay rate, and shifts.
The prompt above was compiled from the original drawing commands and is for reference only.