
Exponential Function and Cone Relationship
Loading the math board and drawing, please wait…
In collections
Mapping Diagrams: From AB to C&DE, Resource
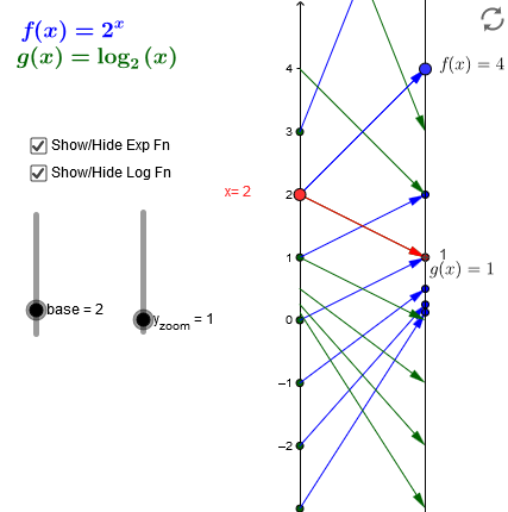
This example demonstrates the relationship between an exponential function and a cone. Key mathematical concepts include exponential functions and cones. Using GeoGebra commands such as Point, Vector, Textfield, and Sequence, a dynamic graph of the exponential function and a cone model are constructed. Suitable for high school mathematics education and learning.
GeoGebra Commands & Parameters
Point(yAxis) → A_1Vector(A_1, B) → uTextfield(f) → inputBox1Sequence((0, k), k, -3, 3) → SourcePtsMDSequence((k, f(k)), k, -3, 3) → ExpGraphptsVector(A_1, B_2) → vSequence((f(k), k), k, -3, 3) → logGraphptsVector(B_2, A_2) → wSequence(Vector[(0, k), (2, (y_{zoom} * f(k)))], k, -3, 3) → ExpMDSequence((2, (y_{zoom} * f(k))), k, -3, 3) → ExpTargPtsSequence(Vector[(2, k), (4, (y_{zoom} * f(k)))], k, -3, 3) → InvLogMDSequence(Vector[(0, f(k)), (2, (y_{zoom} * g(f(k))))], k, -3, 3) → logMD