
Exponential Demand Model Demonstration
Loading the math board and drawing, please wait…
In collections
CCGPS AA Unit 6 Lesson 1
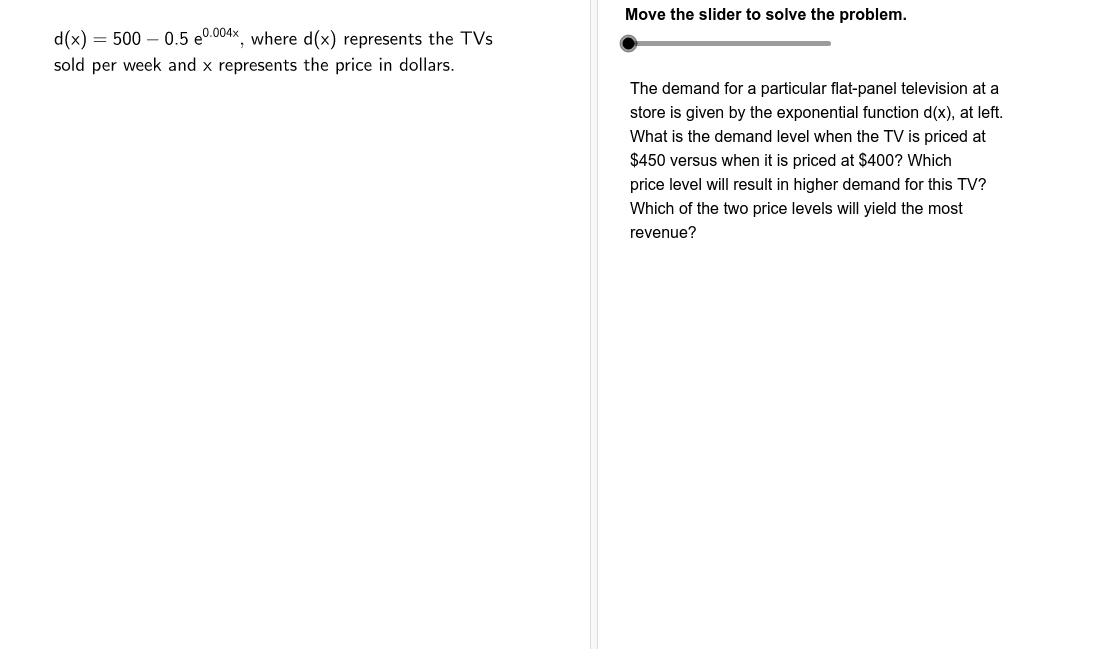
This example demonstrates the exponential function model of demand for a specific flat-panel television at a store over time. It involves core mathematical concepts such as exponential functions, derivatives from calculus, and optimization problems. GeoGebra commands/objects used include Textfield, step, DirectionsSlider, Directions4, Directions5, Directions6, d, Price2, Price1, Price1Box, Price2Box, Cost, Directions2, work3c, demand1, demand2, compWord, work5a, rev1, rev2, work5b, revCompared, Directions3, Directions1, BaseEquation, work2c, work2a, work2b, work3a, work3b, result2, result3, work4, work5c. Suitable for high school students learning calculus and optimization problems.
GeoGebra Commands & Parameters
Textfield(Price1) → Price1BoxTextfield(Price2) → Price2Box
AI Drawing Prompt Reference
Create a graph demonstrating the exponential demand model for a specific flat-panel television at a store over time, including input and display boxes for two prices, to show the core mathematical concepts such as exponential functions, derivatives from calculus, and optimization problems based on these prices.
The prompt above was compiled from the original drawing commands and is for reference only.