
Exponential Curve Sketching Demo
Loading the math board and drawing, please wait…
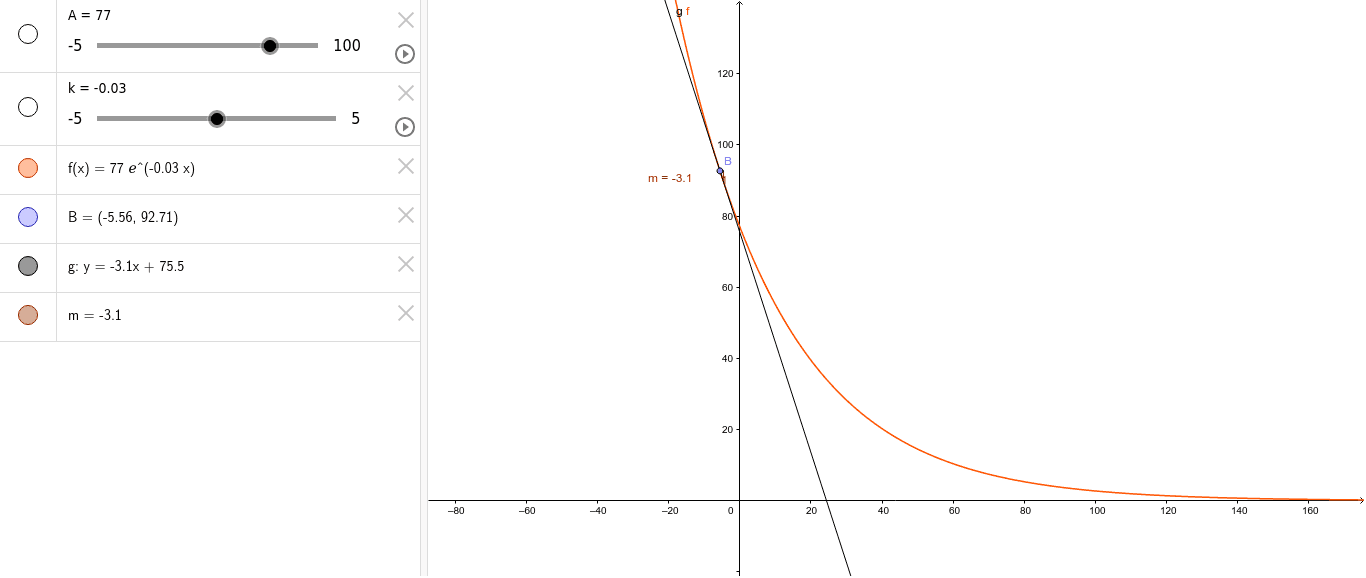
This example demonstrates the sketching of exponential functions, focusing on their graphs, derivatives, and tangent lines. It involves core math concepts like exponential functions, derivatives, slopes, and tangents. Constructed using GeoGebra commands Point, Tangent, Slope, and objects A, k, f, B, g, m. Ideal for high school students learning calculus and function graphing, suitable for classroom demonstrations and understanding function properties.
GeoGebra Commands & Parameters
Point(f) → BTangent(B, f) → gSlope(g) → m
AI Drawing Prompt Reference
Draw the graph of an exponential function, showing its derivative and tangent line. First, identify a point on the exponential function, then draw a tangent line at that point, and calculate the slope of the tangent line, combining these elements to display the relationship between the function, tangent, and slope, suitable for demonstrating function properties in a teaching context.
The prompt above was compiled from the original drawing commands and is for reference only.