
Exponential and Logarithmic Functions: Graphs and Properties
Loading the math board and drawing, please wait…
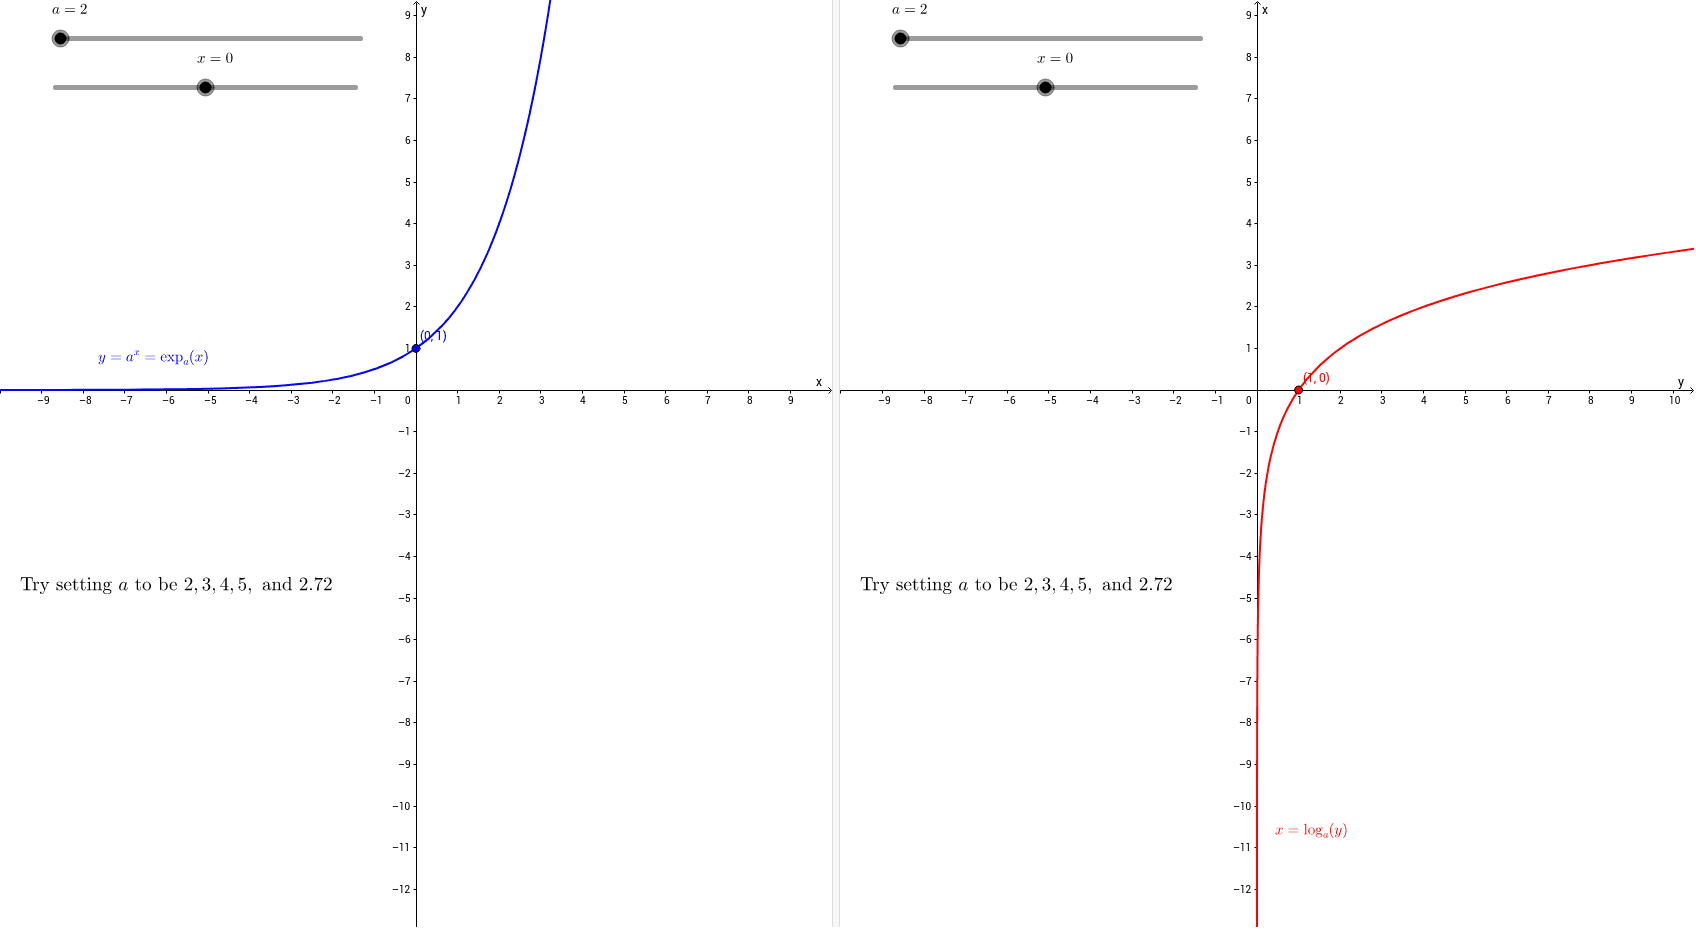
①This GeoGebra example dynamically illustrates the graphs of exponential and logarithmic functions and their mutual relationship, highlighting their symmetry about the line y=x. ②Core mathematical concepts include exponential functions, logarithmic functions, inverse functions, graph translations and transformations, as well as domain and range changes. ③Construction details: The summary lists objects a and b as parameters (likely base and translation), f and g as the exponential and logarithmic functions, A and B as points on the graphs, and text1, text2, text1_1 as labels for function expressions or key coordinates; adjusting sliders or parameters allows dynamic observation of graph changes. ④It is suitable for high school students learning function properties, inverse functions, and graph transformations, either for classroom demonstration or self-exploration, and also useful for pre-calculus review.
GeoGebra Commands & Parameters
Numeric a(2.0)Numeric b(0.0)f(x) = a^(x)g(x) = log(a, x)(b, a^(b))(a^(b), b)
AI Drawing Prompt Reference
Draw the graphs of exponential and logarithmic functions, showing their symmetry about the line y=x, with sliders to adjust the base and translation parameters for dynamic graph changes, and label key points and function expressions.
The prompt above was compiled from the original drawing commands and is for reference only.