
Exploring the Graphs of Exponential Functions
Loading the math board and drawing, please wait…
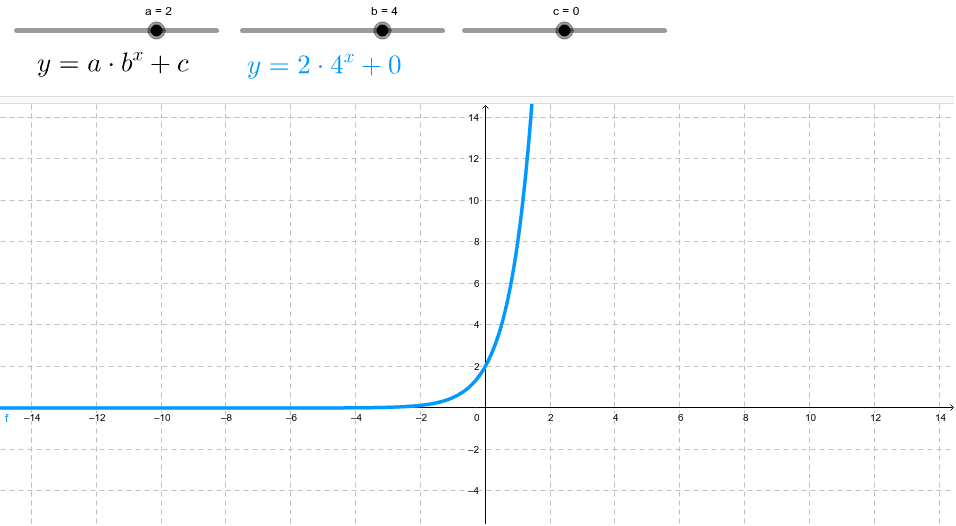
This GeoGebra example dynamically demonstrates how the graph of an exponential function changes with varying parameters, visually showing the effects of base, coefficient, and constant terms on the shape of the curve. Core mathematical concepts include exponential functions, logarithmic functions, parametric curves, tangent lines, and hyperbolas, involving function transformations and graphical properties. The construction uses sliders to control parameters a, b, and c, defines the function f, and employs text objects text1 and text2 to display the function expression and key values, allowing observation of the dynamic changes in the graph as parameters vary. Suitable for high school and pre-university students learning exponential functions and their transformations, as well as for classroom demonstrations or independent exploration, helping to understand exponential growth and decay, asymptotes, and function shifts and stretches.
GeoGebra Commands & Parameters
Numeric a(2)Numeric b(4)Numeric c(0)f(x) = (a * b^(x)) + c