
Exploring the Effect of Parameter k
Loading the math board and drawing, please wait…
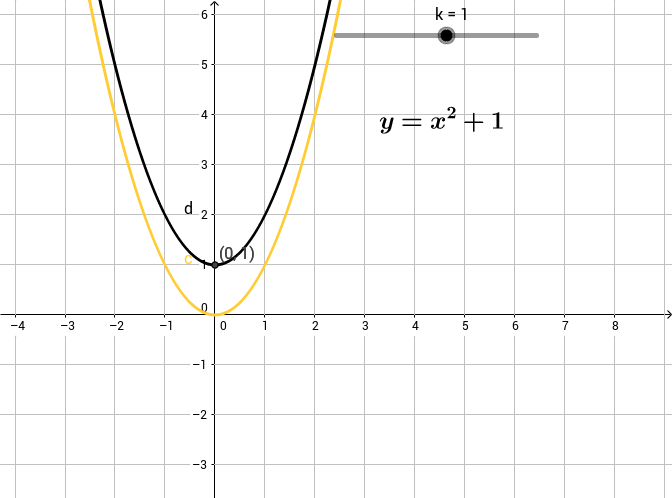
This example demonstrates observing the changes in function graphs by varying parameter k. Core math concepts include function graph transformations, parametric equations, and analytical geometry. GeoGebra commands used are Vertex, involving objects c, k, d, text1, A_1, A. Suitable for high school mathematics education to understand the impact of parameters on function graphs and their geometric significance.
GeoGebra Commands & Parameters
Vertex(d) → A_1, , ,Vertex(d) → A, , ,
AI Drawing Prompt Reference
Draw a function graph and add a slider to adjust parameter k, observing the changes in the function graph as k varies. Mark the key vertices of the function in the coordinate system and show the trajectory of the vertices as parameter k changes.
The prompt above was compiled from the original drawing commands and is for reference only.