
Exploring Straight Line Equations via Coordinate Transformation
Loading the math board and drawing, please wait…
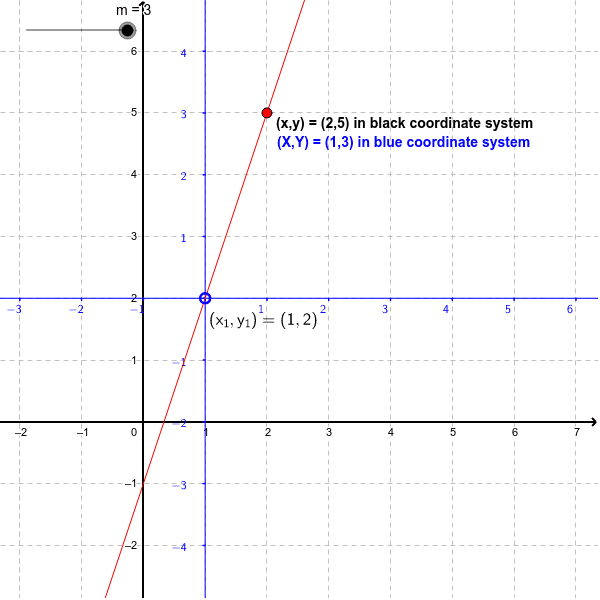
This example demonstrates how to explore the equation of a straight line graph through a given point with a specified gradient by changing the coordinate system. It involves core mathematical concepts such as coordinate transformation, straight line equations, and gradient. Construction highlights include the use of GeoGebra commands and objects like TableText, Corner, Distance, Text, Line, Sequence, and Point. Suitable for high school mathematics teaching or self-study to understand the impact of coordinate transformation on straight line equations.
GeoGebra Commands & Parameters
TableText({{"0"}, {"\ \ \ \ \ \ \ \ \ \ \ \ \ \ \ \ "}}, "hc") → Xt0Corner(1) → corner1Corner(3) → corner3Corner(2) → corner2Corner(4) → corner4Corner(5) → screenDimDistance(corner1, corner2) → distXDistance(corner1, corner4) → distYText("$(x_1,y_1)=(" + (x(O)) + "," + (y(O)) + ")", (x(O), y(O) - 10 / unitY), true, true) → text3Line(O, xAxis) → XaxisLineSequence(Segment[(n + x(O), y(O)), (n + x(O), y(O) - 2 / unitY)], n, (round((x(Corner[1]) - x(O)) / AxisStepX[]) * AxisStepX[]), x(Corner[2]) - x(O), AxisStepX[]) → XaxisTicksLine(O, yAxis) → YaxisLineSequence(Segment[(x(O), y(O) + n), (x(O) - 2 / unitX, y(O) + n)], n, (round((y(Corner[1]) - y(O)) / AxisStepY[]) * AxisStepY[]), y(Corner[4]) - y(O), AxisStepY[]) → YaxisTicksPoint(a) → AText("(x,y) = (" + (x(A)) + "," + (y(A)) + ") in black coordinate system") → text2Text("(X,Y) = (" + (x(A) - x(O)) + "," + (y(A) - y(O)) + ") in blue coordinate system") → text1Sequence(If[n ≟ 0, "", Text[TableText[{{"" + (n) + ""}, {"\ \ \ \ \ \ \ \ \ \ \ \ \ \ \ \ "}}, "hc"], (n + x(O) - (Distance[Corner[Xt0, 1], Corner[Xt0, 2]] * 0.5) - 3 / unitX, y(O) - 2 / unitY), true, true]], n, (round((x(Corner[1]) - x(O)) / AxisStepX[]) * AxisStepX[]), x(Corner[2]) - x(O), AxisStepX[]) → XaxisNumbersSequence(If[n ≟ 0, "", Text[TableText[{{"\phantom{(}" + (n) + ""}, {"\phantom{(} \ \ \ \ \ \ \ \ \ \ \ \ \ \ \ "}}, "hr"], (x(O) - Distance[Corner[Xt0, 1], Corner[Xt0, 2]] - 4 / unitX, n + y(O) + (Distance[Corner[Xt0, 1], Corner[Xt0, 4]] * 0.25) + 1 / unitY), true, true]], n, (round((y(Corner[1]) - y(O)) / AxisStepY[]) * AxisStepY[]), y(Corner[4]) - y(O), AxisStepY[]) → YaxisNumbers
AI Drawing Prompt Reference
Draw a coordinate system with x and y axes, and mark the ticks on the x-axis. Plot a point in the coordinate system and display its coordinates. Draw a straight line through the point and show its equation. Transform the coordinate system by translation and observe the changes in the line's equation. Label the origin, axes, tick marks, and point coordinates, using different colors for the original and transformed coordinate systems.
The prompt above was compiled from the original drawing commands and is for reference only.